Fiscal Year 2018 Proposed Budget Overview
Overview of the Fiscal Year 2018 Proposed General Fund Budget process, including quarterly reviews, budget workshops, personnel changes, revenue projections, millage rate proposals, and financial planning presentations leading up to the adoption of the final budget.
Download Presentation

Please find below an Image/Link to download the presentation.
The content on the website is provided AS IS for your information and personal use only. It may not be sold, licensed, or shared on other websites without obtaining consent from the author.If you encounter any issues during the download, it is possible that the publisher has removed the file from their server.
You are allowed to download the files provided on this website for personal or commercial use, subject to the condition that they are used lawfully. All files are the property of their respective owners.
The content on the website is provided AS IS for your information and personal use only. It may not be sold, licensed, or shared on other websites without obtaining consent from the author.
E N D
Presentation Transcript
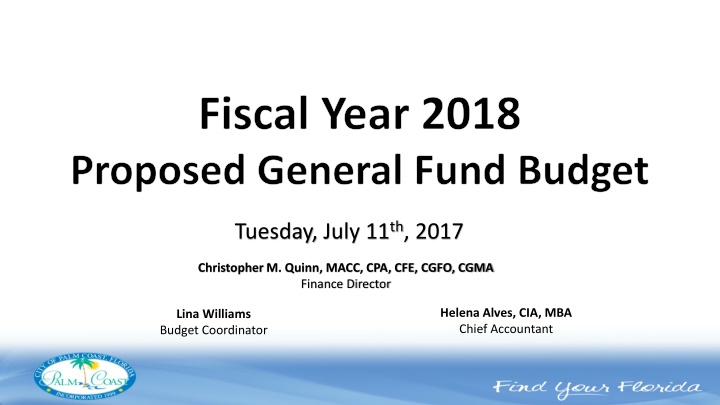
Fiscal Year 2018 Proposed General Fund Budget Tuesday, July 11th, 2017 Christopher M. Quinn, MACC, CPA, CFE, CGFO, CGMA Finance Director Helena Alves, CIA, MBA Chief Accountant Lina Williams Budget Coordinator
January - March First Quarter Review Annual Financial Audit Presentation of Annual Progress Report Survey Results to City Council Annual Update of the Strategic Action Plan April Revise 10 Year Infrastructure Plan Year to Date Budget Results Presentation Fund Accounting & Revenue Presentation Second Quarter Review Departments Begin FY 2018 Budget Preparation
May June Long Term Financial Planning Presentation Property Tax Review Presentation July - August General Fund Budget Workshop Adopt Maximum Millage Rate (August 4th deadline) Third Quarter Review Capital Funds Budget Workshop Special Revenue & Proprietary Funds Budget Workshop Final Proposed Budget Presentation
September Public Hearing to Tentatively Adopt Millage Rate & Budget Public Hearing to Adopt Final Millage Rate & Budget October December FY 2017 Year End Close-out End of Year Review with Departments
Proposed Personnel Changes General Fund Expenditures General Fund Revenue Projections Millage Rate Options Options that Require Additional Funding
Proposed Personnel Changes New Positions: Parks Facilities Maintenance: 4 Equipment Operators Construction Management & Engineering: Project Coordinator Parks & Recreation: Recreation Manager (April start date) Budget includes 3% average merit raise and 2.5% adjustment to starting salaries in January.
2018 Maximum Millage Rate Proposal Millage Rate 2018 Proposed TRIM Rate 4.2450 2017 Millage Rate 4.2450
General Fund Summary Budget 2017 31,987,472 Proposed 2018 33,943,905 Change 2017-2018 1,956,433 Percentage Change 6.1% Total Expenditures Budget 2017 234.83 Proposed 2018 240.83 Change 2017-2018 Percentage Change 2.6% General Fund Personnel (FTEs) 6.00 Budget 2017 31,987,472 Estimated 2017 32,216,296 Percentage Change 0.7% Change 228,824 Total Projected Expenditures
Administration Summary Budget Proposed 2017 3,616,094 3,752,540 Change 2017-2018 136,446 Percentage Change 3.8% 2018 Administration Budget 2017 27.00 Proposed 2018 27.00 Change 2017-2018 0.00 Percentage Change 0.0% Personnel (FTE) Budget 2017 3,616,094 Estimated 2017 3,545,928 Percentage Change -1.9% Change (70,166) Administration Includes: City Council, City Manager s Office, Communications & Marketing, Central Services, City Clerk s Office, Human Resources, City Attorney, Economic Development and Financial Services
City Managers Office Budget 2017 370,188 Proposed 2018 381,009 Change 2017-2018 10,821 Percentage Change 2.9% Expenditures Budget 2017 370,188 Estimated 2017 367,100 Percentage Change -0.8% Change (3,088) Expenditures
Communications & Marketing Budget 2017 415,401 Proposed 2018 426,734 Change 2017-2018 11,333 Percentage Change 2.7% Expenditures Budget 2017 415,401 Estimated 2017 407,006 Percentage Change -2.0% Change (8,395) Expenditures
Central Services Budget 2017 329,718 Proposed 2018 350,794 Change 2017-2018 21,076 Percentage Change 6.4% Expenditures Budget 2017 329,718 Estimated 2017 329,718 Percentage Change 0.0% Change Expenditures -
City Clerks Office Budget 2017 149,522 *Proposed 2018 182,286 Change 2017-2018 32,764 Percentage Change 21.9% Expenditures Budget 2017 149,522 Estimated 2017 147,045 Percentage Change -1.7% Change (2,477) Expenditures *Includes a portion of 2018 election costs ($5,000) and facilitator for charter review ($7,500).
City Attorney Budget 2017 453,284 Proposed 2018 470,391 Change 2017-2018 17,107 Percentage Change 3.8% Expenditures Budget 2017 453,284 Estimated 2017 453,284 Percentage Change 0.0% Change Expenditures - *Includes half of City Clerk/Paralegal and City Attorney costs.
Financial Services Budget 2017 928,183 Proposed 2018 938,231 Change 2017-2018 10,048 Percentage Change 1.1% Expenditures Budget 2017 928,183 Estimated 2017 923,643 Percentage Change -0.5% Change (4,540) Expenditures
Human Resources Budget 2017 519,386 Proposed 2018 556,102 Change 2017-2018 36,716 Percentage Change 7.1% Expenditures Budget 2017 519,386 Estimated 2017 494,436 Percentage Change -4.8% Change (24,950) Expenditures
Economic Development Budget 2017 342,682 Proposed 2018 333,447 Change 2017-2018 (9,235) Percentage Change -2.7% Expenditures Budget 2017 342,682 Estimated 2017 316,082 Percentage Change -7.8% Change (26,600) Expenditures
Construction Management & Engineering Budget 2017 1,728,658 Proposed 2018 1,973,900 *Change 2017-2018 245,242 Percentage Change 14% Expenditures Budget 2017 19.25 Proposed 2018 20.25 *Change 2017-2018 Percentage Change 5% FTE *Project Coordinator 1.00 Budget 2017 1,728,658 Estimated 2017 1,726,645 Percentage Change -0.1% Change (2,013) Expenditures
Planning Budget 2017 1,492,399 Proposed 2018 1,516,015 Change 2017-2018 23,616 Percentage Change 1.6% Expenditures Budget 2017 1,492,399 Estimated 2017 1,456,595 Percentage Change -2.4% Change (35,804) Expenditures
Code Enforcement Budget 2017 2,252,963 Proposed 2018 2,343,520 Change 2017-2018 90,557 Percentage Change 4.0% Expenditures Budget 2017 2,252,963 Estimated 2017 2,248,932 Percentage Change -0.2% Change (4,031) Expenditures
Law Enforcement Budget *Proposed 2017 2018 2,720,287 2,785,903 Change 2017-2018 65,616 Percentage Change 2.4% Expenditures Budget 2017 2,720,287 Estimated 2017 2,702,137 Percentage Change -0.7% Change (18,150) Expenditures *Per contract with FCSO: (1) Commander $166,034 (3) Sergeants $460,949 (2) Corporals $279,821 (16) Deputies $1,768,564 (1) School Resource Deputy $110,535
Fire Budget 2017 7,933,112 Proposed 2018 8,648,477 *Change 2017-2018 715,365 Percentage Change 9.0% Expenditures Budget 2017 7,933,112 Estimated 2017 8,403,235 Percentage Change 5.9% *Change 470,123 Expenditures *Change in holiday pay, new union contract and employee retention program
Parks & Recreation Budget 2017 1,476,011 Proposed 2018 1,613,432 Change 2017-2018 137,421 Percentage Change 9.3% Expenditures 2017 8 2018 9 *2017-2018 Change 12.5% FTE *Recreation Manager (start April 2018) 1 Budget 2017 1,476,011 Estimated 2017 1,474,202 Percentage Change -0.1% Change (1,809) Expenditures
Tennis Center Budget 2017 285,000 Proposed 2018 292,398 Change 2017-2018 7,398 Percentage Change 2.6% Expenditures Budget 2017 285,000 Estimated 2017 285,000 Percentage Change 0.0% Change Expenditures -
Golf Course Budget 2017 1,605,000 Proposed 2018 1,546,037 Change 2017-2018 (58,963) Percentage Change -3.7% Expenditures Budget 2017 1,605,000 Estimated 2017 1,605,000 Percentage Change 0.0% Change Expenditures -
Parks Facilities Maintenance Budget 2017 1,641,975 Proposed 2018 2,111,527 *Change 2017-2018 469,552 Percentage Change 28.6% Expenditures 2017 17 2018 21 *2017-2018 Change 23.5% FTE 4 *(4) Equipment Operators Budget 2017 1,641,975 Estimated 2017 1,636,268 Percentage Change -0.3% Change (5,707) Expenditures
Streets & Drainage Budget 2017 6,130,370 Proposed 2018 6,132,254 Change 2017-2018 1,884 Percentage Change 0.0% Expenditures Budget 2017 6,130,370 Estimated 2017 6,067,131 Percentage Change -1.0% Change (63,239) Expenditures
Non-Departmental Budget 2017 1,105,603 *Proposed 2018 1,227,902 *Change 2017-2018 122,299 Percentage Change 11.1% Expenditures * Includes value adjustment board contingency Budget 2017 1,105,603 Estimated 2017 1,065,223 Percentage Change -3.7% Change (40,380) Expenditures *Includes: RSVP Cultural Arts Grants $30,000 Historical Society Lobbying Contract CRA TIF $25,000 $3,000 $45,000 $580,431
General Fund Revenue Projections Budget 2017 Property Taxes* 17,283,759 Other Taxes 3,073,966 Permits, Fees & Special Exceptions 1,042,625 Intergovernmental 3,931,406 Fines and Forfeitures Charges for Services 5,350,566 Other Revenue Transfers Total General Fund Revenue 31,987,472 *2018 Based on Proposed TRIM Rate *Proposed 2018 18,440,366 1,156,607 3,098,966 1,002,625 3,983,558 405,000 6,033,240 140,000 840,150 33,943,905 1,956,433 Change 2017-2018 25,000 (40,000) 52,152 15,000 682,674 65,000 Percentage Change 6.7% 0.8% -3.8% 1.3% 3.8% 12.8% 86.7% 0.0% 6.1% 390,000 75,000 840,150 - Budget 2017 31,987,472 **Estimated 2017 32,216,296 Percentage Change 0.7% Change 228,824 Total General Fund Revenue **Includes $451,500 appropriated fund balance
% Change over Prev Year 12.34% -12.52% -14.43% -14.94% -12.80% -6.31% 1.21% 5.48% 6.10% 4.72% Ad Valorem Receipts Fiscal Year Property Value Operating Millage Capital Millage Total Millage 2008 2009 2010 2011 2012 2013 2014 2015 2016 2017 Change 2008-2017 7,009,877,421 6,131,965,169 5,246,998,187 4,463,085,550 3,891,594,126 3,646,122,021 3,690,312,857 3,892,358,641 4,129,619,115 4,324,453,760 2.2123 2.6123 3.15 3.5 3.54 4.1502 4.1932 4.1609 4.0828 4.112 0.75 0.35 0.35 - 0.45 0.1456 0.0773 0.0841 0.1622 0.133 2.96234 2.9623 3.5 3.5 3.99 4.2958 4.2705 4.245 4.245 4.245 20,184,340 17,602,781 17,828,406 15,048,300 15,000,700 15,120,750 15,203,633 15,963,477 16,973,093 17,803,620 -2,685,423,661 -38% 1.8997 -0.617 1.28266 -2,380,720 FY 2018 Certified Taxable Value is $4,614,500,630 (6.71% increase over 2017)
4.2450 2017 Millage Rate 4.2450 2018 Proposed Rate 6.6621 7.3283 2018 Majority Vote Rate 2018 Two-thirds Vote Rate
2018 Maximum Millage Rate Proposal % Millage Rate Taxes Generated* $ Change FY 17-18 Change FY 17-18 2017 Millage Rate 4.2450 $17,803,619 $418,442 $17,243,759 $141,418 Stormwater Fund Portion General Fund Portion Capital Projects Fund Portion 2018 Proposed TRIM Rate 4.2450 $18,902,956 $1,099,337 $502,590 $18,400,366 $1,156,607 6% Stormwater Fund Portion General Fund Portion $84,148 * Based on City's historical collection rate
Requires Additional Funding Option Additional Deputies Additional Streetlighting Economic Development Coordinator Environmental Planning Technician Budget Impact $110,535/deputy $200,000 $100,000 $69,000 New Capital Projects ?
July 18th July 25th August 8th August 29th Adopt Maximum Millage Rate (August 4th deadline) Budget Workshop Capital Funds Budget Workshop Proprietary Special Revenue Funds Final Proposed Budget Presentation September: Public Hearing to adopt tentative millage rate and Budget & Final Public Hearing to adopt final millage and budget
