Efficient Guide for Extracting and Managing PowerSchool Grades and Attendance Reports


PowerSchool
Grades and Attendance
Report


PowerSchool
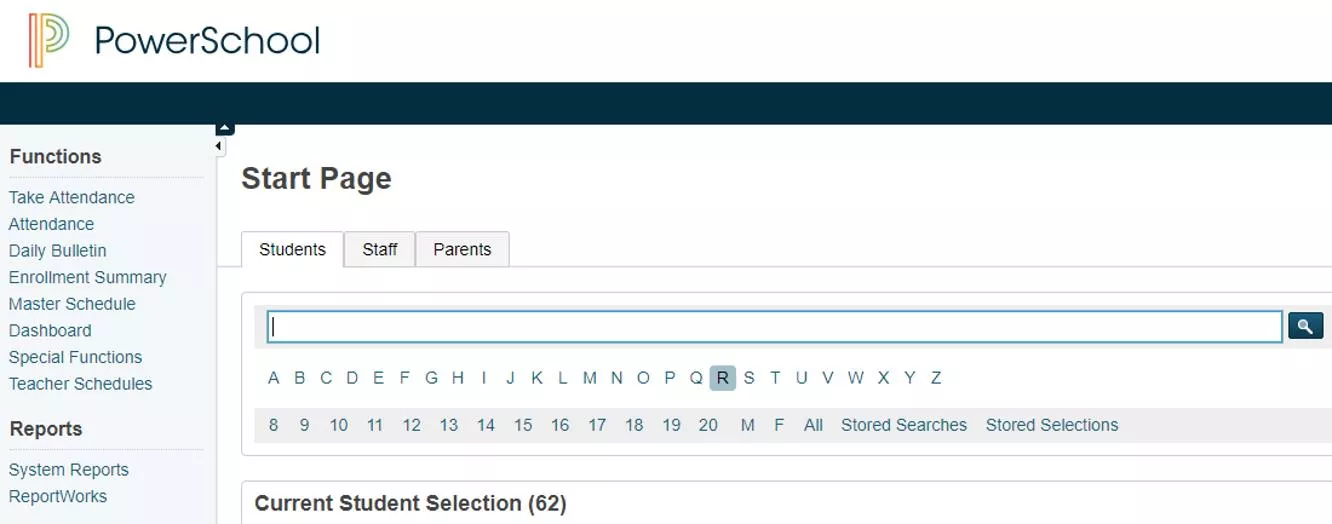
Begin by selecting a group of students from your
“Stored Searches” or simply select a grade level


Select
“Special Functions”
Select
“Search by
Grades/Attendance”
Select Report Criteria
Be sure your report is set to run the criteria circled and click
SUBMIT
:
Change according to
grading
period/semester
You can choose other
grades in this format:
A,A+,A-,B,B+,B-, etc.
Select Students and Copy to Excel
Select students by
clicking on
“STUDENT”, hold LEFT
mouse button down
and drag to the
bottom of the report.
Release button
RIGHT click mouse
and “COPY”
Copy Data to Excel
Open Excel and paste
data from PowerSchool
Into Excel
In cell “A1”
RIGHT click the mouse
and Select “Paste
Special” to paste only the
VALUES from the
PowerSchool report.
Run Absences for Selected Students
The selected
students should still
be your “Current
Student Selection”
From this screen,
click “List Students”
Print Absences and Demographic Data (if needed)
Set up the report with Column
Titles and Fields
Fields for this report are:
Student_Number
LastFirst
*Dabs
Gender
Ethnicity
S_IN_STU_X.Exceptionality_Primary
S_IN_STU_X.ENG_Lang_Prof_Level
LunchStatus
*Dabs
will only work for 1
st
Semester or ALL
YEAR absences. If you want only absences
for second semester, you will need to use
the following:
*Dabs;(begindate);enddate
Select all students and copy to Excel
Select students by
clicking on “ID”,
hold LEFT mouse
button down and
drag to the bottom
of the report.
Release button
Right Click mouse
and “COPY”
Copy Data to Excel
Paste data from
PowerSchool
Into Excel
Return to Excel and click
on “Sheet2.” In cell “A1”,
RIGHT click and select
“Paste Special” to paste
only the VALUES from the
PowerSchool report.
Use Sort & Filter Options to view the data you want
Use the “Sort” feature to
view alphabetize students,
teachers, or courses.
Use the Filter option to view a
specific group of students.
This filter shows female
students with less than 5
absences.
Comprehensive step-by-step instructions on how to generate, manipulate, and analyze student grades and attendance data using PowerSchool. Learn to select student groups, run reports, copy data to Excel, extract absences, print demographic information, and efficiently manage all gathered data.

Download Presentation

Please find below an Image/Link to download the presentation.
The content on the website is provided AS IS for your information and personal use only. It may not be sold, licensed, or shared on other websites without obtaining consent from the author. Download presentation by click this link. If you encounter any issues during the download, it is possible that the publisher has removed the file from their server.
E N D
Presentation Transcript
PowerSchool Grades and Attendance Report
PowerSchool Begin by selecting a group of students from your Stored Searches or simply select a grade level
Select Special Functions Select Search by Grades/Attendance
Select Report Criteria Be sure your report is set to run the criteria circled and click SUBMIT: You can choose other grades in this format: A,A+,A-,B,B+,B-, etc. Change according to grading period/semester
Select Students and Copy to Excel Select students by clicking on STUDENT , hold LEFT mouse button down and drag to the bottom of the report. Release button RIGHT click mouse and COPY
Copy Data to Excel Open Excel and paste data from PowerSchool Into Excel In cell A1 RIGHT click the mouse and Select Paste Special to paste only the VALUES from the PowerSchool report.
Run Absences for Selected Students The selected students should still be your Current Student Selection From this screen, click List Students
Print Absences and Demographic Data (if needed) Set up the report with Column Titles and Fields Fields for this report are: Student_Number LastFirst *Dabs Gender Ethnicity S_IN_STU_X.Exceptionality_Primary S_IN_STU_X.ENG_Lang_Prof_Level LunchStatus *Dabs will only work for 1st Semester or ALL YEAR absences. If you want only absences for second semester, you will need to use the following: *Dabs;(begindate);enddate
Select all students and copy to Excel Select students by clicking on ID , hold LEFT mouse button down and drag to the bottom of the report. Release button Right Click mouse and COPY
Copy Data to Excel Paste data from PowerSchool Into Excel Return to Excel and click on Sheet2. In cell A1 , RIGHT click and select Paste Special to paste only the VALUES from the PowerSchool report.
Use Sort & Filter Options to view the data you want Use the Sort feature to view alphabetize students, teachers, or courses.
Use the Filter option to view a specific group of students. This filter shows female students with less than 5 absences.


")