Economic Openness and GDP Growth Volatility Analysis
This presentation explores the relationship between trade openness, economic volatility, and GDP growth, with a focus on the vulnerability/resilience framework. It aims to test the hypothesis that GDP growth volatility is influenced by trade openness, economic governance, and the stage of economic development.

Download Presentation

Please find below an Image/Link to download the presentation.
The content on the website is provided AS IS for your information and personal use only. It may not be sold, licensed, or shared on other websites without obtaining consent from the author.If you encounter any issues during the download, it is possible that the publisher has removed the file from their server.
You are allowed to download the files provided on this website for personal or commercial use, subject to the condition that they are used lawfully. All files are the property of their respective owners.
The content on the website is provided AS IS for your information and personal use only. It may not be sold, licensed, or shared on other websites without obtaining consent from the author.
E N D
Presentation Transcript
ECONOMIC OPENNESS AND GDP GROWTH VOLATILITY Lino Briguglio and Melchior Vella University of Malta Delivered at the University of Mauritius September 2017
Objective of the presentation The objective of this presentation is to test whether trade openness leads to economic volatility, keeping other relevant things constant. This theme has been investigated in various studies, as we shall show in the literature review. However this particular study place the analysis within the vulnerability/ resilience framework, proposed by Briguglio et al. (2009). One would expect that if a country depends highly on economic conditions in other countries, its economic situation will also be highly exposed to external shocks, possibly leading to GDP growth volatility in the country in question. Likewise, a high dependence on imports is likely to lead to a high degree of exposure to economic conditions in the rest of the world. There are other reasons why trade openness leads to GDP growth volatility - these will be discussed in the section on the literature. 1. Introduction
The hypothesis The hypothesis to be tested in this paper is that GDP growth volatility depends on trade openness, on economic governance and on the stage of development of a given economy, the latter variable possibly proxying social and political governance in the country concerned. The approach to be used to test this relationship is the regression method, using panel data. This proposed relationship is an extension of the arguments put forward by Briguglio et. al (2009) and Briguglio (2016), where factors that lead to economic vulnerability were juxtaposed against factors that lead to economic resilience in order to assess the risk of a country being harmed by external shocks. These two studies were not based on regression analysis, but on observations of variables that lead to economic vulnerability and resilience, which enabled the authors to classify countries, in terms of the so-called vulnerability and resilience (V&R) framework. The present study attempts to statistically test this relationship. 1. Introduction
The Singapore paradox The confirmation of the hypothesis of this study may help to explain the so-called Singapore paradox referred to in Briguglio et al. (2009), meaning that highly-open economies can and do generate high GDP per capita in spite of the fact that openness, by itself, tends to generate volatility, which is often considered to be harmful to growth. The possibility that GDP growth volatility is influenced by economic, social and political governance, may also help to explain why some highly-open economies do not exhibit a high degree of GDP growth volatility, while economies which are not highly open to trade exhibit a high degree of volatility - the reason being that good economic, political and social governance may be conducive to the reduction of volatility. 1. Introduction
Layout The presentation is organised in five sections as follows. Section 2, which follows this introduction, will present a brief literature review on the relationship between trade openness and GDP growth volatility. Section 3 will explain the methodology utilised in this study to test the relationship between trade openness and GDP growth volatility, and will present the estimation results. The section will also report on some diagnostic tests relating to the validity of the results. Section 4 will conclude the study with a number of implications that are derived from the results presented in the previous section. 1. Introduction
The themes covered in the literature review This literature review is organised in four main sections as follows: 1. The opposing effects of trade openness 2. Openness and economic volatility 3. Openness and economic growth 4. The downsides of volatility 5. Equations to estimate the relationship 2. Literature review
Two opposing effects...1 Trade openness if often though to bring real benefits, including improved productivity and enhanced variety of goods at lower cost to consumers . In addition, producers would be able to sell on world markets, thus earning more than if the same products were sold only on the domestic market (Jensen, 2004). In this sense, it may be argued that trade openness is conducive to economic growth, ceteris paribus. However, trade openness is also thought to usher in GDP growth volatility, which is considered to be a downside. Di Giovanni & Levchenko (2009), when investigating the channels through which trade openness affects volatility, distinguished between different economic sectors, and argued that trade openness is likely to lead countries to increase the degree of specialization, implying a higher risk due to having too many eggs in one basket. 2. Literature review
Two opposing effects...2 Many authors associate openness with volatility, including Loayza & Raddatz (2007), Karras & Song (1996), Easterly & al. (2001), Di Giovanni & Levchenko (2006) and Krishna & Levchenko (2009). It will be shown later on in this literature review that GDP volatility is thought to likely harm growth. Therefore, trade openness is often considered as good for GDP growth, but it also generates volatility which is thought to be bad for GDP growth. In the literature, one finds various papers that refer to these two opposing effects of openness. Easterly & Kraay (2000) refer to these tendencies when discussing small economies, which are often highly open to trade. These authors argue that the positive and negative effects of openness may offset each other in the case of small states. 2. Literature review
Openness leads to volatility ...2 Some authors consider that export concentration exacerbates the effect on trade openness on volatility. Jensen (2004) argues that this effect is increased if exports are concentrated in commodities, including oil, that are characterized by high price volatility. This view is echoed by Haddad et al. (2010) who argue that export diversification (the obverse of concentration), both across products and markets, reduces growth volatility. The authors first discussed the mechanisms by which trade openness affects growth volatility, with one of the variables considered being export diversification indicators. They found evidence that export diversification reduces the effect of trade openness on growth volatility. Diversification and volatility is also discussed in 2. Literature review
Openness leads to volatility ...3 Various authors, while admitting that trade openness leads to GDP growth volatility, also acknowledge the importance of domestic in attenuating or exacerbating volatility, including governance, institutional frameworks and domestic economic policy. For example, Easterly et al. (2001) contend that output volatility, while being affected by external shocks, is also influenced by the manner in which the economy reacts to such shocks. Acemoglu et al. (2003), Fat s & Mihov (2013), Gavin & Hausmann (1996), and Malik & Temple (2009) refer to the effect of the domestic institutional quality on volatility, including the possibility that openness leads to a higher risk of policy mismanagement if political institutions are weak, which, according to (Ahmed 2003) could intensify the negative effects of external shocks. On this matter see also Chang et al. (2009). 2. Literature review
Openness leads to volatility ...4 Some studies argue that the extent of volatility caused by trade openness depends on the stage of development. Abubaker (2015) found that trade openness increases output volatility, but countries with a higher level of development are affected to a lower extent in this regard. In the same vein, Jensen (2004) contends that GDP per capita has a significantly effect on income volatility. This may explain why particularly poor economies, like Least Developed Countries (LDCs), are also characterized by high income volatility, even though they do not tend to be characterized by particularly high levels of openness. According to some authors, volatility in particularly intense when exports consist mainly or to a high degree of commodities (Koren &Tenreyro, 2007) which is characteristic of many developing countries, and institutional quality 2. Literature review
Openness leads to volatility ...5 Some studies distinguish between different types of trade openness, arguing that some forms of openness are highly destabilising. Jackman (2014) investigated the relationship between tourism specialization and output volatility in a sample of 34 small island developing states (SIDS). The conclusion is that there appears to be a positive relationship between tourism and output volatility, and that the impact of tourism on economic volatility depends greatly on the level of volatility in tourism . Dabla-Norris & Srivasal (2013) examine the impact of financial depth on macroeconomic volatility and find that financial depth could lead to a dampening of output volatility, but only up to a point. They find that at very high levels, such as those observed in many advanced economies, financial depth amplifies volatility. On this matter see also Tornell et al. (2003). 2. Literature review
Openness leads to volatility ...6 A number of studies do not confirm the positive effects of openness to trade and volatility. A case in point is Cavallo (2007) who presents empirical evidence that suggests that, after appropriately accounting for the likely endogeneity of trade, the net effect of trade openness on output volatility is stabilizing. This view is echoed in Cavallo & Frankel (2008). Bowdler & Malik (2005) argue that trade openness can reduce volatility through limiting recourse by shifting consumption and production towards goods for which the terms of trade are relatively stable. Hegerty (2014), likewise concludes that trade openness appears to be correlated with a reduction in output volatility for LDCs. 2. Literature review
Openness leads to volatility ...7 Bejan (2005) argues that once one controls for government size and some measures of external risk, such as export concentration index, the effect of openness on the output volatility turns out to be negative. Studies that associate openness with a lower degree of volatility also base their arguments on the possibility that international trade permits a country to better integrate into the world economy, further permitting the possibility of policy reforms that lead to stability. 2. Literature review
Openness and economic growth...1 Although, most studies conclude that trade openness generates GDP growth volatility, which is a downside, openness is generally found to be positively related to GDP growth. Studies that associate openness with growth often base their arguments on the possibility that international trade stimulates competitiveness, leading to increased productivity and innovation, improves resource allocation and lowers prices for consumers. Such arguments are proposed by Winters (2004); Easterly & Kraay (2000). Some studies show that the positive effect of trade openness on economic growth, is particularly possible with a conducive institutional framework (Dollar and Kraay, 2003) 2. Literature review
Openness and economic growth...2 There are studies, however that show that the quality of institutions is an important consideration in assessing the effects of trade openness. Calderon & Fuentes (2006) argue that countries with strong institutions receive the largest benefit of trade openness. Yanikkaya (2003), goes as far as to show that openness may actually not be good for growth. The author shows through his estimation that trade barriers are positively and significantly associated with growth, especially for developing countries. Some authors also distinguish between the long and short runs, referring to adjustment costs of trade openness in the short run, possibly leading to poverty and inequality (Goldberg & Pavcnik, 2004). 2. Literature review
The downsides of volatility...1 The arguments derived from the literature so far generally point out that while openness may be good for growth, (with a few dissenting voices), it also has negative effects by generating volatility. This leads to the question as to why volatility is undesirable. There are various reasons for this, including that fluctuations can generate a welfare loss (Loayza et al., 2007) through the negative effect of uncertainty (economic, political, and policy-related). This matter is also discussed in Montalbano (2011). In addition, volatility ushers in a higher risk of policy failure and weak economic governance (Fat s & Mihov, 2005, Gavin & Hausmann, 1996, and Rodrik, 1999), including fiscal and monetary policies that intensify rather than calm the trade cycle. 2. Literature review
The downsides of volatility...2 Some authors argue that that volatility tends to lead to lower growth (Ramey and Ramey, 1995), particularly on poor countries (Easterly et al., 2000). Hnatkovska & Loayza (2005) for example, estimate that a one standard-deviation increase in macroeconomic volatility results in an average loss of 1.3 percentage points in annual per capita GDP growth. On the other side of the coin, Kose et al. (2004) found that trade openness appears to attenuate the negative growth-volatility relationship. Specifically, they find that the estimated coefficients on interactions between volatility and trade integration are significantly positive, suggesting that countries that are more open to trade appear to be able to tolerate higher volatility without hurting their long-term growth. 2. Literature review
The downsides of volatility...3 Garc a-Herrero & Vilarrubia (2006) building upon the general consensus that followed the study by Ramey and Ramey, (1995), namely that that the volatility of per capita GDP growth reduces growth, showed empirically that a moderate degree of volatility can be growth-enhancing, while very high volatility is clearly detrimental. These results point to the existence of a Laffer curve between volatility and growth. Meschi and Vivarelli (2007) find that that of trade of developing countries with high income countries are destabilising as they worsen income distribution in developing country, both through imports and exports. This would seem to suggest that technological differentials between trading partners are important factors in explaining the affects of volatility that result from economic openness. 2. Literature review
Model specifications in the literature In the literature, the procedure often used to estimate the relationship between openness and volatility is generally the regression method, often utilising panel data. GDP growth volatility is measured by the standard deviation of GDP growth, and openness is generally measured as the average of exports and imports, as a ratio of GDP (e.g. Hadded & et. Al., 2010). The control variables utilised in the regression equations varied, as indicated in the preceding slides of this literature review, and included variables standing for policy and institutional frameworks, stage of development, export concentration, terms of trade, financial liberalisation, and geographical dummy variables. 2. Literature review
Growth Volatility Model To test the hypothesis that trade openness generates GDP growth volatility, annual data for 171 countries spanning the years from is used to estimae the following equation: VLTi,t= + OPNi,t + EGVi,t + PGVi,t + i,t (1) where VLT is GDP volatility, OPN refers to trade openness , ECG refers to economic governance and PGV refers to political governance, measured by with this last variable possibly also capturing political the stage of development as these two variables are highly correlated. The subscripts indicate that all variables refer to country i in year t. Further, i,t is assumed to be normally distributed with mean 0 and constant variance. The period covered by the panel data is 2010-2015. The manner in which the variable were measured is explained in the appendix. 3. Estimation results
Growth Volatility Model The basic assumption underpinning Equation (1) is that GDP volatility is influenced by trade openness, keeping political and economic governance constant. A priori, one expects that trade openness (OPN) has a positive effect on growth volatility. On the other hand economic and political governance (ECG and PGV) are expeced to have a negative effect on volatility, in that these two variable could attenuate the effect of trade openness. The estimation of Equation (1) was carried out using panel data, assuming fixed effects, following the application of the Hausman test for panel data estimation. This test decisively favours the use of Fixed Effects estimator over Random Effects . 3. Estimation results
Estimation Results From the available data, the estimation results are as follows: VLT t-statistics (6.89) (5.14) (-4.17) (-2.93) = 2.24 + 0.04 OPN - 2.71 EGV - 1.85 PGV (1) R-squared = 0.84 Number of observations = 1,026 The estimated parameters are in line with a priori expectations. The numbers in parentheses are the t-statistics and indicate that the estimates of the coefficient on the explanatory variables are statistically different from zero at the 95% level. 3. Estimation results
Estimation Results The equation performed satisfactorily in terms of residual diagnostic tests. Pooled unit root tests were also conducted on the variables, showing that the null hypothesis of having a unit root process is not accepted at 1% level. Regarding multicollinearity, the correlation between OPN, EGV and PGV across countries was not found to be unduly high. 3. Estimation results
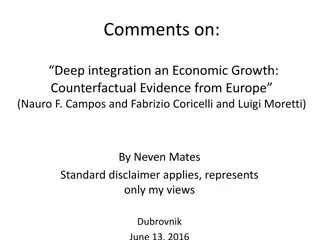
Results confirm the hypthesis The results would seem to suggest that the hypothesis that GDP growth volatility is the result of trade openness and good governance is confirmed. This implies that volatility can be the result not only by high exposure to external economic conditions but also of internal governance factors. This implication is illustrated in Figure 1, where GDP growth volatility is measured along the vertical axis and trade openness on the horizontal axis. The markers show volatility with and without the governance effect, utilising the estimation results of Equation 1. Volatility without governance is estimated by removing the governance terms from the estimated equation (shown by the large round grey markers in the diagram, with a straight line trend line) and volatility with governance is estimated by including the governance terms in the estimated equation (shown by the diamond shaped small markers in the diagram). 3. Estimation results
Implications of the results 12 11 10 9 GDP growth volatility 8 Maldives 7 BelizeEq. Guinea Singapore Hong Kong 6 Malta Lao PDR Venezuela 5 Sierra Leone 4 Luxembourg 3 Ireland 2 Netherlands Poland Estonia 1 Germany 0 0 20 40 60 80 100 Trade Openness 120 140 160 180 200 220 240 . 3. Estimation results
Implications of the results From this chart we can identify four possible scenarios into which countries can be grouped, as explained below. The right section of the diagram relates to those countries that have a relatively high degree of trade openness, in this case higher than 50%. Some register a volatility score below the trend line, indicating that the governance effect has attenuated their volatility, as shown by a downward-pointing arrow. Others have a volatility score above the trend line, indicating that governance has intensified their volatility, as shown by the upward-pointing arrow. This means that the right side of the diagram has two types of economies, namely (a) highly-open economies with good governance (HOGG) which include Malta, Singapore, and Luxembourg and (b) highly-open economies with weak governance (HOWG) which include Equatorial Guinea, Maldives and Belize. 3. Estimation results
Implications of the results The left section of the diagram relates to those countries that have a relatively low degree of trade openness. Again, well-governed countries register a volatility score below the trend line, while weakly-governed countries have an intensified volatility score above the trend line. This means that the left side of the diagram has two additional types of economies, namely (c) slightly-open economies (less than 50% of GDP) with good governance (SOGG), including USA, Germany and Poland and (d) slightly-open economies with weak governance (SOWG), including Venezuela, Sierra Leone and Russia. 3. Estimation results
Implications of the results The economies of small states are generally characterised by a high degree of trade openness, meaning that they are likely to be highly exposed to growth volatility. Using the benchmarking exercise proposed in Figure 1, the distinction between attenuated or intensified volatility can be made. Small states with a volatility score below the trend line in Figure 1 are those that have possibly attenuated their growth volatility through good economic and political governance. Conversely, small states with a volatility score above the trend line are those that possibly exacerbated their volatility as a result of weak governance. 3. Estimation results
Small states, volatility and governance Table 2 provides an overview of small states in terms of their growth volatility with and without governance as measured from the estimated regression. Almost all of the small states in Europe are endowed with good governance scores that mitigated volatility associated with trade openness. Similarly, governance scores are also conducive to the reduction of volatility in most of the small states in the Caribbean region. By contrast, the picture is mixed in African, Atlantic/Indian and Pacific regions. Such benchmarking verifies the small state paradox (Briguglio et al., 2009), such that highly-open economies can and do withstand their inherent vulnerability by adopting policies that counteract growth volatility. 3. Estimation results
Small states, volatility and governance It should be recalled that governance captures the effects of political (PGV) as well as economic governance (EGV), and consequently their separate scores could reinforce or counteract each other. By way of example, Cyprus ranked amongst the weakly governed countries because its weak economic governance (high debt-to-GDP ratio and large current account deficit) more than offset the effect of the favourable political governance score. Conversely, Bahrain ranked behind Cyprus with regard to the political governance score, however, it performed very well in terms of economic governance, and that is why it was ranked among the well-governed countries. 3. Estimation results
Small states, volatility and governance Table 2: Small states classified by degree of openness and governance . 3. Estimation results
Results confirm the hypthesis This study has tested the relationship between trade openness and GDP growth volatility, using a sample of 171 countries. The regression equation was kept as simple as possible, reflecting the possibility that GDP growth volatility is influenced by trade openness, economic governance and political governance, the latter variable also possibly proxying the stage of development. By keeping other relevant variables constant, this study confirms the hypothesis that trade openness exacerbates growth volatility. However, the possibility that growth volatility is mitigated by good economic and political governance is also confirmed. This may explain why some economies do not exhibit a high degree of GDP growth volatility even though they are highly-open. 4. Conclusions and implications
Main implications The main implication of these results is that countries that are highly dependent on international trade, including most small states, would be exposed to GDP growth volatility, which has various downsides, as explained in the literature review. However, it does not necessary follow that highly trade-open economies - small states in particular - are the ones that experience the highest degree of GDP growth volatility, if these countries adopt appropriate policies. In other words it is possibly that highly-open economies do not exhibit a high degree of GDP growth volatility, while economies which are not highly trade-open may exhibit a high degree of volatility - the reason being that good economic, political and social governance may be conducive to the reduction of such volatility. 4. Conclusions and implications
Major implication The major implication that can be derived from this study is the following: Highly trade-open countries, in particular small states, are those countries which mostly need to adopt good economic, social and political governance, if they are to counteract growth volatility, with all its downsides. This is in line with the vulnerability/resilience framework, proposed in Briguglio et. Al (2009) and Briguglio (2016), where factors that lead to economic vulnerability were juxtaposed against factors that lead to economic resilience in order to assess the risk of a country being harmed by external shocks. This framework was used to show that small economically vulnerable states, can, and do, adopt policies that enable them to withstand the downsides of economic vulnerability. 4. Conclusions and implications
References1 Abubaker, R. (2015). The asymmetric impact of trade openness on output volatility, Empirical Economics Volume 49 (3): 881 887. http://link.springer.com/article/10.1007/s00181-014-0899-2 Acemoglu, D., S. Johnson, J. Robinson, & Y. Thaicharoen (2003). Institutional Causes, Macroeconomic Symptoms: Volatility, Crises and Growth , Journal of Monetary Economics, 5(1): 49-123 http://dev.wcfia.harvard.edu/sites/default/files/903__jr_JMEpublishedversion.pdf Ahmed, Shaghil (2003). Sources of Economic Fluctuations in Latin America and Implications for Choice of Exchange Rate Regimes . Journal of Development Economics 72(1) (October): 181 202 . http://www.federalreserve.gov/PubS/ifdp/1999/656/ifdp656.pdf Bejan Maria (2006). Trade Openness and Output Volatility Maria Bejan ITAM (Instituto Tecnologico Autonomo de Mexico) . https://mpra.ub.uni- muenchen.de/2759/1/MPRA_paper_2759.pdf Bowdler, C. and Malik, A. (2005), Openness and inflation volatility: Panel data evidence. https://www.nuffield.ox.ac.uk/economics/papers/2005/w14/maydraft2.pdf. Briguglio (2016). Exposure to external shocks and economic resilience of countries: evidence from global indicators. Journal of Economic Studies, Vol. 43(6) http://www.emeraldinsight.com/doi/pdfplus/10.1108/JES-12-2014-0203 Briguglio, L., Cordina, G., Farrugia, N. and Vella, S. (2009).'Economic Vulnerability andResilience: Concepts and Measurements',Oxford Development Studies,Vol. 37(3): 229-247. http://www.tandfonline.com/doi/abs/10.1080/13600810903089893 . Calderon, C. & Fuentes, R. (2006) Complementarities between Institutions and Openness in Economic Development: Evidence for a Panel of Countries. Cuadernos de Econom a, Vol. 43:49-80, 2006http://www.scielo.cl/scielo.php?pid=S0717-68212006000100002&script=sci_arttext&tlng=en . Cavallo (2007). Output Volatility and Openness to Trade: A Reassessment1 Eduardo A. Cavallo Inter-American Development Bank August 2007 . http://www.iadb.org/res/publications/pubfiles/pubWP-604.pdf Cavallo, E.A., & Frankel., J.A. (2008). Does openness to trade make countries more vulnerable to sudden stops, or less? using gravity to establish causality. Journal of International Money and Finance, 27(8), 1430-1452. https://core.ac.uk/download/pdf/6441476.pdf C sar Calder n, C. & Schmidt-Hebbel, K. (2008). Openness and growth volatility. Central Bank of Chile, Working Papers N 483. file:///C:/Users/User/Downloads/Dialnet-OpennessAndGrowthVolatility-2870626.pdf Chang, R., Kaltani, L., & Loayza, N. V. (2009). Openness can be good for growth: The role of policy complementarities. Journal of Development Economics, 90(1), 33-49. http://dx.doi.org/10.1016/j.jdeveco.2008.06.011 Dabla-Norris, E. and Srivisal, N. (2013). Revisiting the Link Between Finance and Macroeconomic Volatility https://www.imf.org/external/pubs/ft/wp/2013/wp1329.pdf di Giovanni, Julian & Andrei A. Levchenko (2009). Trade Openness and Volatility . Review of Economics and Statistics 91(3) (August): 558 585. http://www.alevchenko.com/JAvol_19Nov07.pdf Dollar, D., & Kraay, A. (2003). Institutions, trade, and growth. Journal of Monetary Economics, Vol.50(1): 133-162. file:///C:/Users/User/Downloads/Institutions,Trade_and_Growth[1]%20(1).pdf Easterly, W. and Kraay, A. (2000). small States, Small Problems? Income, Growth, and Volatility in Small States. World Development Vol. 28 (11): 2013-2027. https://williameasterly.files.wordpress.com/2010/08/25_easterly_kraay_smallstatessmallproblems_prp.pdf
References2 Easterly, Wiliam R., Roumeen Islam & Joseph E. Stiglitz (2001). Shaken and Stirred: Explaining growth volatility. http://www.rrojasdatabank.info/wbdevecon00-12.pdf Fatas, A. & Mihov, I. (2013). Policy Volatility, Institutions and Economic Growth Review of Econimics and Statistics Vol. 45(2): 362-376 http://faculty.insead.edu/fatas/volgrowth.pdf Garc a-Herrero, A. & Vilarrubia, J. (2006).The Laffer curve of macroeconomic volatility and growth: can it be explained by the different nature of crises? Paper prepared by A. Garc a-Herrero and J. Vilarrubia presented at the XI Meeting of the Network of America Central Bank Researchers hosted by Banco Central de la Rep blica Argentina, in Buenos Aires, November 22-24, 2006. http://www.bis.org/repofficepubl/arpresearch_fs_200706.02.pdf . Gavin, M. and Hausmann, R. (1996).Macroeconomic Volatility and Economic Development in The Political Dimension of Economic Growth, Part of the series International Economic Association Series: 97-116. http://link.springer.com/chapter/10.1007/978-1-349-26284-7_5 Goldberg, P.J. & Pavcnik, N. (2004). Trade, inequality, and poverty: what do we know? Evidence from recent trade liberalization episodes in developing countries. NBER Working Paper 10593Growth Volatility . In Boris Pleskovic & Nicholas H. Stern (editors), Annual World Bank Conference on Development Economics, volume 2000, pp. 191 211. Washington, DC: The World Bank. https://core.ac.uk/download/pdf/6880972.pdf Hadded, M., Lim, J.J. & Saborawski, C. (2010) .Trade Openness Reduces Growth Volatility When Countries are WellDiversified World Bank Policy Research Working Paper No. 5222 . https://papers.ssrn.com/sol3/papers.cfm?abstract_id=1565983 Hegerty, S. W. (2014) Openness and Macroeconomic Volatility: Do Development Factors Drive Such Ambiguous Results? http://www.omicsgroup.org/journals/openness-and-macroeconomic-volatility-do-development-factors-drive-such-ambiguous-results-2168-9458-3- 136.php?aid=36386 Hnatkovska, V. and Loayza, N. (2005). Volatility and growth . In Managing economic volatility and crises, Aizenmann, J. and Pinto, B.(eds). Cambridge: Cambridge University Press. http://documents.worldbank.org/curated/en/154121468765320854/pdf/WPS3184.pdf Jackman, M. (2014). Output volatility and tourism specialization in small island developing states. Tourism Economics, 20(3), 527-544. http://teu.sagepub.com/content/20/3/527.abstract Jensen, M. (2004) Income volatility in small and developing economies: export concentration matters. WTO. https://www.wto.org/english/res_e/booksp_e/discussion_papers3_e.pdf Karras, G. & Song, F. (1996). Sources of business-cycle volatility: An exploratory study on a sample of OECD countries. Journal of Macroeconomics. Volume 18(4): 621- 637 http://www.sciencedirect.com/science/article/pii/S0164070496800553 Koren, M. & Tenreyro S. Volatility and Development . The Quarterly Journal of Economics, Vol. 122 (1): 243-287. http://personal.lse.ac.uk/tenreyro/volatilitydev.pdf Kose, M.A., E. Prasad & M. Terrones (2004). How Do Trade and Financial Integration Affect the Relationship Between Growth and Volatility? Washington, DC, United States: International Monetary Fund. Mimeographed document. http://citeseerx.ist.psu.edu/viewdoc/download?doi=10.1.1.468.3552&rep=rep1&type=pdf Krishna, P & Levchenko, A (2009). Comparative Advantage, Complexity and Volatility. NBER Working Paper No. 14965. http://www.alevchenko.com/w14965.pdf Loayza, N. V. , Ranciere, N. and Serven, L. And Ventura, j. () Macroeconomic Volatility and Welfare in Developing Countries: An Introduction. The World Bank Economic Review, VOL. 21(3): 343 357. http://romainranciere.com/research/WBER.pdf
References3 Loayza, N.V. & Raddatz, C. (2007) The Structural Determinants of External Vulnerability The Structural Determinants of External Vulnerability . The World Bank Economic Review, VoL. 21 (3): 359 387 . http://documents.worldbank.org/curated/en/641521468336280437/pdf/775550JRN020070uctural0Determinants.pdf Malik, A. & and Temple, J. (2009). The geography of output volatility Journal of Development Economics, 2009, vol. 90, issue 2, pages 163-178. http://www.sciencedirect.com/science/article/pii/S0304387808001053 Meschi, E. & Vivarelli, M. (2007) Trade openness and income inequality in developing countries. Working Paper. Coventry: University of Warwick. Centre for the Study of Globalisation and Regionalisation. Working papers (University of Warwick. Centre for the Study of Globalisation and Regionalisation) (No.232). http://www2.warwick.ac.uk/fac/soc/pais/research/researchcentres/csgr/papers/workingpapers/2007/wp23207.pdf Montalbano, P.L. (2011); Trade Openness and Developing Countries Vulnerability: Concepts, Misconceptions, and Directions for Research. World Development, Vol. 39 (9): 1489 1502. http://www.sciencedirect.com.ejournals.um.edu.mt/science/article/pii/S0305750X11000283 Ramey, G., Ramey, V., 1995. Cross-Country Evidence on the Link Between Volatility and Growth, The American Economic Review, Vo. 85, No. 5, pp. 1138 1151 Rodrik, D. (1999). Where Did All the Growth Go? External Shocks, Social Conflict, and Growth Collapses. Journal of Economic Growth, Vol. 4 (4): 385 412. http://link.springer.com/article/10.1023/A:1009863208706 . Tornell, A., Westermann, F., Martinez, L.: Liberalization, Growth and Financial Crises: Lessons from Mexico and the Developing World , Brookings Papers on Economic Activity No. 2 (2003). https://muse.jhu.edu/article/51245/summary Winters, L. A. (2004). Trade liberalisation and economic performance: An overview The Economic Journal, vol. 114: pp. F4 F21. http://onlinelibrary.wiley.com/doi/10.1111/j.0013-0133.2004.00185.x/abstract Yanikkaya, H. (2003). Trade openness and economic growth: a cross-country empirical investigation. Journal of Development economics, 72(1), 57-89. https://www.researchgate.net/profile/Halit_Yanikkaya/publication/222566984_Trade_openness_and_economic_growth_a_cross- country_empirical_investigation/links/00b495395771495af0000000.pdf
Data Appendix ...1 OPNis measured as the average of imports and exports of goods and services as a ratio of GDP [(Exports + Imports)/2] /GDP). The data was sourced from the UNCTAD statistics. PGV is measured by the Rule of Law indicator of the so-called Kaufman Index, which ranges between -2.5 and +2.5. Negative values are considered as bad political governance, with higher negative values representing higher levels of bad governance, while positive values are considered as indicators of good governance, with higher positive values representing high levels of good governance. Without good governance in place, it would be relatively easy for adverse shocks to result in economic and social chaos and unrest. Thus the term for the PGV will represent an intensification effect on volatility when it takes a negative value, and an attenuation effect on volatility when it takes a positive value, given that its estimated coefficient is negative.
Data Appendix ...2 EGV (economic governance) is measured in two alternative ways. First, this variable is measured solely by the debt as a ratio of GDP. Second, we consider the average of the following two indices, namely (i) debt as a ratio of GDP and (ii) current account imbalances as a ratio of GDP. Following Briguglio et al. (2009) and Briguglio (2016), these indicators were chosen because they were thought to be policy induced and are therefore closely related to economic governance. It should be noted here that economic governance is likely to be the result of many other factors for which data is sparse (such as the unemployment rate, particularly in the case of small states) or which are difficult to capture quantitatively. The debt/GDP ratio is thought to be related to economic governance, with high debt ratios indicating weak governance in this regard. Low debt ratios would allow room for manoeuvre in taxation and expenditure in the face of adverse shocks. (Briguglio et al., 2009). A country with a high current account deficits may find it more difficult to mobilize resources in order to offset the effects of economic shocks.
References3 The debt/GDP component was considered as representing good economic governance if its value is 60% or lower, with lower values being taken as representing improving economic governance. Conversely, ratios higher than 60% were considered as associated with bad economic governance, with higher ratios being associated with deteriorating economic governance. The debt/GDP ratio was rescaled so that 60% was set to equal zero, while values equal to or higher than 60% were rescaled to take values of between 0 and -0.5 and values equal to or lower than 60% were rescaled to take values of between 0 and 0.5. This procedure of assigning negative values for weak economic governance is helpful for drawing Figure 1, as will be explained in Section 4. The current account /GDP component was considered as being associated with good economic governance if its value was 0 or higher, with higher values representing improving economic governance. Conversely, negative values of the ratio were associated with bad economic governance with higher negative ratios being associated with worse economic governance. Positive and negative values of the ratio were rescaled to take a value of between +0.5 and -0.5. This rescaling procedure was useful in order to take an average of the debt ratio and the current account balance, since both were rescaled to take a value of between -0.5 and +0.5, with zero being the point of neutrality.
Data Appendix ...3 To separate the effects of initial cyclical factors both the debt to GDP and current account imbalances ratio are measured with a 10-year backward moving average. The data was sourced from: Source: http://unctadstat.unctad.org/wds/ReportFolders/reportFolders.aspx Sourced from: http://info.worldbank.org/governance/wgi/index.aspx#home . Note about the debt ratio: A debt-to-GDP ratio of 60% is considered as a prudential limit for the EU member states, and a higher ratio is considered be fiscally unsustainable. However there is considerable debate on this threshold value of the Debt/GDP ratio (see Chowdhury and Islam, 2014). Note about the current account ratio: Although a current account surplus is generally considered to be a better situation than a current account deficit, one could question whether such a surplus is a sign of good economic governance, as such a situation may signify that a country could improve its standard of living, by, for example, stimulating demand and encouraging imports. In addition, a current account surplus may push up the exchange rate of a floating domestic currency. On the other hand, a current account deficit may be an indication that a country is living beyond its means, and therefore not sustainably thus associating it with weak economic governance. In addition, a deficit reflects relatively lower national savings in relation to investment. On this issue see Ghosh and Ramakrishnan (2006). The cut of value of zero is somewhat arbitrary, but it will not affect the statistical significancee of the estimated coefficients. It will however be of some importance when interpreting the results, given that a value of less than zero will be interpreted as an indicator of bad economic governance, with higher negative values suggesting a higher degree of bad governance Source: http://www.imf.org/external/pubs/ft/weo/2016/01/weodata/index.aspx