GDP and Economic Indicators
Evaluating the economy involves analyzing total income per person, comparing revenue and spending, and examining GDP per capita. GDP, a key economic indicator, reflects the total market value of goods and services produced in a country. Rich data sources like World Bank provide insights into various economic indicators across nations.

Download Presentation

Please find below an Image/Link to download the presentation.
The content on the website is provided AS IS for your information and personal use only. It may not be sold, licensed, or shared on other websites without obtaining consent from the author.If you encounter any issues during the download, it is possible that the publisher has removed the file from their server.
You are allowed to download the files provided on this website for personal or commercial use, subject to the condition that they are used lawfully. All files are the property of their respective owners.
The content on the website is provided AS IS for your information and personal use only. It may not be sold, licensed, or shared on other websites without obtaining consent from the author.
E N D
Presentation Transcript
When judging whether the economy is doing well or poorly, it is natural to look at the total income that everyone in the economy is earning. To have this number make sense, it is also best to look at income per person.
For an economy as a whole, income must equal expenditure because: Every transaction has a buyer and a seller. Every dollar of spending by some buyer is a dollar of income for some seller. Say s Law-Supply creates it s own demand This process can be seen using a Circular Flow Diagram.
Revenue Spending Market for Goods and Services Goods & Services sold Goods & Services bought Firms Households Inputs for production Labor, land, and capital Market for Factors of Production Wages, rent, and profit Income
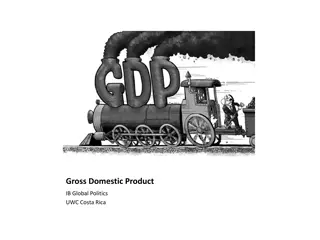
Gross domestic product (GDP) is a measure of the income and expenditures of an economy. It is the total market value of all final goods and services produced within a country in a given period of time. How much is the current GDP per capita?
GDP (current U$) GDP per capita (current U$) GDP per capita (PPP-purchasing power parity) GNI per capita (current U$) GNI per capita (PPP) GDP annual growth Fertility rate Life expectancy Literacy rate
WorldBank.org the rich source of data: https://data.worldbank.org/ Many countries Many indicators
GDP is: GDP can be defined in three ways, all of which are conceptually identical. 1. First, it is equal to the total expenditures for all final goods stipulated period of time (usually a 365-day year). 2. Second, it is equal to the sum of the value added every stage of production (the intermediate stages) by all the industries within a country, plus taxes less subsidies on products, in the period. 3. Third, it is equal to the sum of the income generated by production in the country in the period that is, compensation of employees imports less subsidies, and gross operating surplus (or profits). final goods and services produced within the country in a value added at compensation of employees, taxes on production and gross operating surplus
In economics final goods ultimately consumed rather than used in the production of another good. For example, a car sold to a consumer is a final good The components such as tires sold to the car manufacturer are not; they are intermediate goods final goods are goods that are final good; intermediate goods used to make the final good.
Value added commodity over the cost of commodities used to produce it from the previous stage of production. It refers to the contribution of the factors of production raising the value of a product and corresponds to the incomes received by the owners of these factors. In national accounts such as the United Nations System of National Accounts (UNSNA), gross value added is obtained by deducting intermediate consumption added is equal to net output Value added refers to the additional value of a factors of production, i.e., land, land, labo labou ur, and capital goods r, and capital goods, to intermediate consumption from gross output gross output. Thus gross value net output.
GDP includes all items produced in the economy and sold legally in markets. GDP excludes services that are produced and consumed at home and that never enter the marketplace. Caring labour, the work that is normally produced by women. Because GDP does not count it, it diminishes its importance. GDP also excludes black market items, such as illegal drugs.
Gross National Product (GNP) Net National Product (NNP) National Income Personal Income Disposable Personal Income
GDP (Y ) is the sum of the following: Consumption (C) Investment (I) Government Purchases (G) Net Exports (NX) Y = C + I + G + NX
Total (Billions of Dollars) $8,511 Per Person (In Dollars) $31,522 % of Total GDP (Y) 100% Consumption C 5,808 21,511 68% Investment I 1,367 5,507 16% Government G 1,487 5,507 18% Net Exports NX -151 -559 -2%
Government Purchases 18% Net Exports -2 % Investment 16% Consumption 68 %
We use real GDP to calculate the economic growth rate. The economic growth rate is the percentage change in the quantity of goods and services produced from one year to the next. We measure economic growth so we can make: Economic welfare comparisons International welfare comparisons Business cycle forecasts
Business Cycle Forecasts Real GDP is used to measure business cycle fluctuations.
Nominal GDP values the production of goods and services at current prices. Real GDP values the production of goods and services at constant prices.
Deflating the GDP Balloon Nominal GDP increases because production real GDP increases.
Nominal GDP also increases because prices rise. Deflating the GDP Balloon
We use the GDP Deflator to take the air out of Nominal GDP.
Describe the following indicators: GDP, GNI. Present the data concerning these indicators. Describe the following indicators: GDP per capita (current U$), GDP per capita (PPP). Present the data concerning these indicators. Describe the following indicator: GDP annual growth. Present the data concerning this indicator. Describe the following indicator: population. Present the data concerning this indicator. Describe the following indicator: fertility rate. Present the data concerning this indicator. Describe the following indicators expectancy of life. Present the data concerning this indicator. Describe the following indicator: literacy rate. Present the data concerning this indicator. Describe different indicators of poverty. Present the data concerning this indicators. If export increases the GDP and import decreases, why not try only export of goods without any import? GDP per capita is not the perfect indicator of human development. What should be added and what should be taken away from GDP to build better indicator. Describe the method of measuring the GDP with expenditure approach What is the difference between nominal and real GDP growth? What are the main reasons of economic growth? How Human Development Index is defined? Describe the Index of Economic Freedom. 1. 2. 3. 4. 5. 6. 7. 8. 9. 10. 11. 12. 13. 14. 15.


 is a measure")
")


")
 is the sum of the following:")