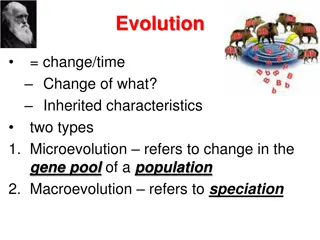
Continuous and Discontinuous Variation in Species
Explore the concepts of continuous and discontinuous variation within species, distinguishing between inherited and environmental factors. Engage in practical activities to represent variation graphically and categorize characteristics based on their variability. Promote interactive learning through organizing groups by eye color, gender, and height to showcase different types of variation. Discover examples of continuous and discontinuous variation through self-assessment tasks and class surveys.

Download Presentation

Please find below an Image/Link to download the presentation.
The content on the website is provided AS IS for your information and personal use only. It may not be sold, licensed, or shared on other websites without obtaining consent from the author.If you encounter any issues during the download, it is possible that the publisher has removed the file from their server.
You are allowed to download the files provided on this website for personal or commercial use, subject to the condition that they are used lawfully. All files are the property of their respective owners.
The content on the website is provided AS IS for your information and personal use only. It may not be sold, licensed, or shared on other websites without obtaining consent from the author.
E N D
Presentation Transcript
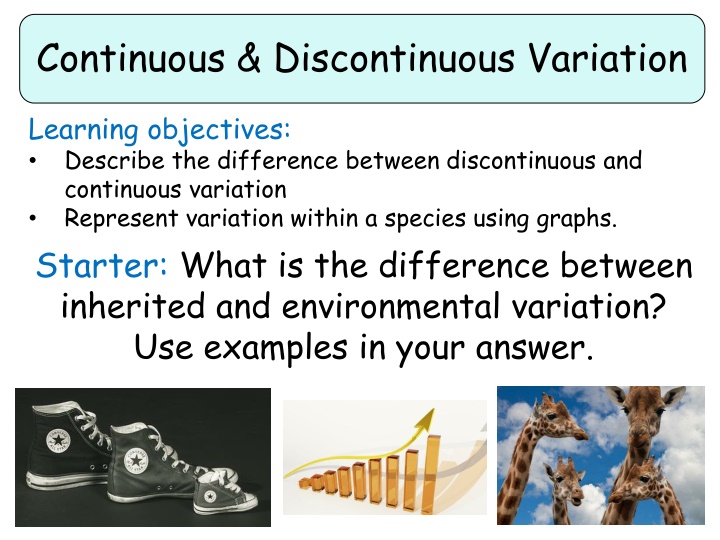
Continuous & Discontinuous Variation Learning objectives: Describe the difference between discontinuous and continuous variation Represent variation within a species using graphs. Starter: What is the difference between inherited and environmental variation? Use examples in your answer.
Continuous & Discontinuous Variation Everyone out of their seats, you are going to organize yourselves based on the following factors: 1. Organise yourselves according to your eye colour. 2. Organise yourselves according to your gender. 3. Organise yourselves according to your height. Think > Pair > Share: What do you notice about the way your organized yourselves for each of these different factors?
Discontinuous variation When you organized yourselves into groups according to gender or eye colour, you divided yourselves into distinct groups. E.g. male or female, green/brown/blue eyes. This is known as discontinuous variation.
Continuous variation When you organized yourselves into groups according to height, you arranged yourselves into one big group standing in height order shortest to tallest. A characteristics that can take any value within a range is known as continuous variation.
The Great Big Class Survey Task: You are going to be organised into groups, each group will be assigned a characteristic. You will need to collect data on this characteristic from at least 20 people in your class, for example shoe size or eye colour. Group 4 Arm length Group 1 Eye colour Group 3 - Height Group 2 Lobed/Lobeless Ears Group 5 Hand span Group 5 Handedness (R/L)
Discontinuous or continuous variation You were each assigned a characteristic to collect class data on. Think > Pair > Share: Which of these categories are examples of continuous variation? Which are examples of discontinuous variation? Eye Colour Handedness Shoe size Height Hand span Lobed/Lobeless Ears
Self-assessment: Discontinuous: Eye colour, handedness & lobed/lobeless ears. Continuous: Hand span, arm length & height.
Plotting discontinuous & continuous data Number of people Number of people A B AB O Height (cm) Blood Group Discontinuous data can be plotted on a bar chart. For example, a person can only have one of four blood groups A, B, AB or O. Continuous data is plotted on a histogram, this shows a range of measurements from one extreme to another. The curve that the graph produces is know as normal distribution.
Task: Now, go back to sitting in your groups and use the data that you collected to plot a graph of your results. (One graph per person, not per group !!) Group 4 Arm length Group 1 Eye colour Group 3 - Height Group 2 Lobed/Lobeless Ears Group 5 Hand span Group 5 Handedness (R/L)
Task: Answer the questions on the worksheet, using the data provided.
Self-assessment: 1. a) Bar chart b) Discontinuous c) No normal distribution 2. a) Continuous b) The older the cheetah the faster they are able to run c) Not very reliable as the top speeds of only three cheetahs were measured 3. a) Continuous b) Yes it shows normal distribution c) Ask a larger number of women
Plenary WhatsApp message Write a WhatsApp message to your friend telling them what you have learnt this lesson!!
Resources Resources
1. a) What sort of graph is this? _____________________________________________ b) Is the data continuous or discontinuous? _____________________________________________ c) Does this graph show normal distribution? _____________________________________________ 2. The graph shows tops speeds reached by three different cheetahs. a) Is the data continuous or discontinuous? _____________________________________________ b) Is relationship does this graph show? _____________________________________________ c) How reliable do you think the data is for predicting the speeds of cheetahs? Explain your answer. _____________________________________________ 3. a) Is the data continuous or discontinuous? _____________________________________________ b) Does this graph show normal distribution? _____________________________________________ c) What could be done to improve the reliability of this data? _____________________________________________
Number of people Arm span (cm) Top speed (km/h) 0 0.5 1.0 1.5 Age (years)


 What sort of graph is this?")