Variation in Statistical Studies


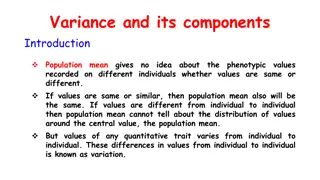
VARIATION
THE HEART OF STATISTICAL STUDY


S
T
U
D
E
N
T
S
N
E
E
D
T
O
B
E
T
H
I
N
K
I
N
G
M
O
R
E
A
B
O
U
T
V
A
R
I
A
T
I
O
N
•
Variability is the heart and soul of the statistical endeavor. If it weren’t for the complexity
of variability in data, statistics would be the past-time of middle-schoolers rather than one
of the worlds leading scientific fields.
•
Research shows that students find it hard to appreciate the role of variability, even when
they are being taught to account and allow for it.
•
Students have, from an early conception of statistical thinking, become very accustomed
to being asked questions in data and chance that prompt them to respond with single
point value answers.
What is the Probability that….?
How many …would you expect?
What is the average of…?
These types of tasks in both research and assessment have tended to mask the issue of
variability.
S
T
U
D
E
N
T
S
N
E
E
D
T
O
B
E
T
H
I
N
K
I
N
G
M
O
R
E
A
B
O
U
T
V
A
R
I
A
T
I
O
N
Questions like:
what is the probability of a year 12 student being taller than 170 cm?
This question evokes a specific answer.
There is a 34% Probability
Students understand the meaning of their answer (or relatively so)
But when a student is
told that Y12 boys have more variation
in their data, they haven’t a clue what that means
They can calculate both IQRs
They can tell you which IQR is bigger
They’ll even tell you that means boys heights have more variation.
But they have no idea what that means
VARIATION, VARIATION,
AND VARIATION
V
A
R
I
A
T
I
O
N
,
V
A
R
I
A
T
I
O
N
,
A
N
D
V
A
R
I
A
T
I
O
N
•
It seems like every time we teach stats, the word variation comes up in a
different way.
•
For example, in inference we say that sampling variability means that when
I take another sample, I will get somewhat different results, etc.
•
But then in the analysis section, I say more variation has something to do
with a bigger IQR
…
•
A
nd then in bivariate and experiments and others I’m dealing with “sources
of variation”, which certainly seems different to the other two?
•
Many students think statisticians just like the word, and that’s why it comes
up under so many different contexts. But actually, we use the same word in
so many different ways, because variation is a concept that has many
manifestations.
V
A
R
I
A
T
I
O
N
W
I
T
H
I
N
S
A
M
P
L
E
S
It all comes from the same underlying idea
•
Lets say we wanted to study boys heights. We know when we take 30 people’s heights, that
we’re not going to keep getting the same number. There will be variation, There will be a
variety of heights.
One thing that contributes to that variety is
“Variation Within Sample” / “Spread”.
•
This contributor is almost entirely a function of how the population behaves.
i.e. if there is a lot of variation within heights of boys in the population, there will more
than likely be lots of variation within heights of boys for the sample
•
It is not decreased by sample size.
V
A
R
I
A
T
I
O
N
B
E
T
W
E
E
N
S
A
M
P
L
E
S
Another thing that contributes to that variety is
“Variation Between Samples”.
•
This is the idea that all samples are different, and it is by chance we picked this
one.
•
This contributes to the variability (variety) in the data. One cannot claim to know
exactly whether in this particular sample it has contributed such and such amount.
However, the amount of variation contributed by samples of the same size is
largely predictable, and when considering descriptors such as mean/median, the
extent of possible variation can be estimated by confidence interval construction.
V
A
R
I
A
T
I
O
N
B
E
T
W
E
E
N
S
A
M
P
L
E
S
Used in everyday teaching
“Variation Within Samples”.
”Therefore the sample of boys heights has significantly more variation than the girls”
what we mean is: the boys heights have
more
variety than the girls.
Could this be a mirror of the population? What would you expect?
“Variation Between Samples”.
A sample of size 10 will have more variation than a sample of size 100
what we mean is: chance plays a more pivotal role in the look of you data
with a sample of size 10 than if you had a sample of size 100
V
A
R
I
A
T
I
O
N
F
R
O
M
N
O
N
S
A
M
P
L
I
N
G
E
R
R
O
R
S
Another thing that contributes to that variety is
“Variation From Non Sampling Errors”/
“Sources of Variation that need to be managed”
•
This is variation caused by factors of data collection that
unduly
affect the variety
in that basket.
•
Whether they increase the variety, or decrease it, both are equally problematic,
because you as a scientist are making discoveries that are compromised.
H
O
W
S
H
O
U
L
D
T
H
E
I
D
E
A
L
S
T
A
T
S
S
T
U
D
E
N
T
D
E
A
L
W
I
T
H
V
A
R
I
A
T
I
O
N
?
We should try to quantify it and describe it meaningfully
We should try to seek explanations for it
When collecting data, we should control our processes so that
we don’t change it unnecessarily (if this one isn’t attended to,
it can render all the above effort inaccurate)
We should not decide on the use of a model without
considering it
VARIATION IN THE
“PLAN” SECTION
H
O
W
S
H
O
U
L
D
T
H
E
I
D
E
A
L
S
T
A
T
S
S
T
U
D
E
N
T
D
E
A
L
W
I
T
H
V
A
R
I
A
T
I
O
N
?
We should try to quantify it and describe it meaningfully
We should try to seek explanations for it
When collecting data, we should control our processes so that
we don’t add to it unnecessarily (if this one isn’t attended to, it
can render all the above effort inaccurate)
We should not decide on the use of a model without
considering it
W
H
A
T
D
O
E
S
M
A
N
A
G
I
N
G
S
O
U
R
C
E
S
O
F
V
A
R
I
A
T
I
O
N
M
E
A
N
?
“managing sources of variation” :
managing anything that might
unduly
increase or
decrease or change in any other way the variation in our data.
C
O
N
S
I
D
E
R
I
N
G
V
A
R
I
A
T
I
O
N
I
N
T
H
E
P
L
A
N
S
E
C
T
I
O
N
•
In the plan section, the statistician should make every effort to manage
sources of variation, possibly through:
•
The application of correct statistical design in order to limit undue effects on
data collection
•
If sampling is involved, random sampling methods should be followed to limit
undue effects caused by a biased/unrepresentative selection.
•
If running a two independent group experiment, groups should be randomised
to limit undue variation caused by unmatched groups.
•
Etc.
•
Expert statistician:
•
Attempt to anticipate variation through researching results of similar studies
completed previously. Decisions around design are often made based on
anticipated variation.
http://powerandsamplesize.com/
S
T
A
N
D
A
R
D
S
T
H
A
T
A
L
L
O
W
M
O
R
E
O
P
P
O
R
T
U
N
I
T
Y
T
O
M
A
N
A
G
E
S
O
U
R
C
E
S
O
F
V
A
R
I
A
T
I
O
N
In 11 Bivariate, Some possible ideas include:
•
how the measures are taken: where to start? Where to end?
We should remove anything that would effect consistency of start point
and end point.
•
How to make sure things are zeroed? (includes a tape measure, they
could have a student other than the one measuring double check the
tape measure’s zero starts where it is meant to start)
•
Inadequacy of equipment and how you will deal with it (weighing scale
looks different from different angles, person taking measurement could
stand in fixed position relative to scale)
•
Remove any other barrier from consistency.
•
In Standards such as experiments, students should be encouraged to go
beyond surface thinking to deeper thinking.
•
I explain it like this.
•
Surface thinking: a person running your experiment would have
considered that difficulty almost immediately, and come up with your
method of dealing it with little thought
•
Deeper thinking: only a person who has pondered deeply into the many
aspects that could effect the results (contribute unduly to variation)
would have thought of that difficulty and/or the way you dealt with it.
S
T
A
N
D
A
R
D
S
T
H
A
T
A
L
L
O
W
M
O
R
E
O
P
P
O
R
T
U
N
I
T
Y
T
O
M
A
N
A
G
E
S
O
U
R
C
E
S
O
F
V
A
R
I
A
T
I
O
N
•
For example:
Question: Does colour effect the number of words you can remember?
•
Surface thinking: Every student will have the same amount of time to
look at and
memorise
the words
•
Deeper thinking: I made sure the words chosen were from different
topics and of different lengths. I was worried that if they were all from
the same topic someone may find them easier to remember. For
example, if most of them are sport related the sporty kids will find
them a lot easier to memorise than the non-sporty kids
S
T
A
N
D
A
R
D
S
T
H
A
T
A
L
L
O
W
M
O
R
E
O
P
P
O
R
T
U
N
I
T
Y
T
O
M
A
N
A
G
E
S
O
U
R
C
E
S
O
F
V
A
R
I
A
T
I
O
N
VARIATION IN THE
“ANALYSIS” SECTION
H
O
W
S
H
O
U
L
D
T
H
E
I
D
E
A
L
S
T
A
T
S
S
T
U
D
E
N
T
D
E
A
L
W
I
T
H
V
A
R
I
A
T
I
O
N
?
We should try to quantify it and describe it meaningfully
We should try to seek explanations for it
When collecting data, we should control our processes so that
we don’t add to it unnecessarily (if this one isn’t attended to, it
can render all the above effort inaccurate)
We should not decide on the use of a model without
considering it
•
I think it is superior for a student to think of data as a story of variation
from which we extract measures of centre, than for a student to think of
data through it’s centre and consider variability around that centre.
•
So, I think it would be superior for a student to acknowledge the statistical
endeavour as an attempt to consider variation of the data, and that:
•
One facet of this, is to extract the central tendency from the variation
in the data. (CENTRE)
•
Another facet, is to describe how much variation there is in the data (SPREAD)
•
Another facet, is to describe the pattern of that variation (SHAPE)
•
Another facet, is to describe unusual aspects of the variation. (UNUSUAL)
I
N
F
E
R
E
N
C
E
DESCRIBING CENTRE
•
Description of
•
Mean
•
Median
•
Difference in mean/median
•
Shift of middle 50%
•
Etc.
I
N
F
E
R
E
N
C
E
DESCRIBING SPREAD
•
RANGE
o
A measure of the extent of variation. What is the extent of varitey in the sample of heights?
•
IQR
o
A measure of typical variation, or, the variation of the generality of sample points.
eg. Everyone greater than the upper quartile can be thought of as “taller people”.
Everyone lower than the lower quartile can be thought of as “shorter people”.
All the people in the IQR could be thought of as the general case of heights.
Therefore, spread of IQR is a good measure of the amount of variety of heights amongst the more typical
boys.
•
STANDARD DEVIATION
o
Again, a measure of typical variation. Generally, the standard deviation is favoured as the measure of
typical variation in more symmetrical data, and IQR is favoured as measure of typical variation in skewed
data.
To make a comparative statement about which group (eg. Boys or Girls) have more spread:
It is superior to use typical measures of spread when making this decision
I
N
F
E
R
E
N
C
E
DESCRIBING SHAPE
•
SKEW/SYMETRY
•
Indicates where the majority of the data lies
, students should ponder why that is.
•
Indicates if there is a tail, students should ponder why that is.
•
UNIMODAL/BIMODAL
•
If a dataset truly is bimodal, it could indicate groups within the data. However,
students seem to struggle to understand the difference between a unimodal dataset
with two towers in and around the peak, compared with truly bimodal data.
I
N
F
E
R
E
N
C
E
DESCRIBING UNUSUAL FEATURES
•
OUTLIERS? (Why?)
•
GAPS? (Why?)
I
N
F
E
R
E
N
C
E
B
I
V
A
R
I
A
T
E
B
I
V
A
R
I
A
T
E
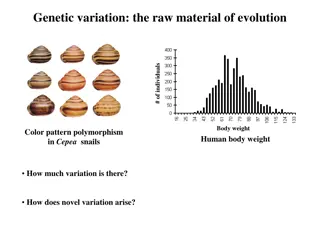
Direction (Positive vs Negative)
Form(Linear vs Non-Linear)
Strength
Scatter (increasing/decreasing/consistent?)
Groupings
Outliers
Gaps
Centre
Centre
Spread
Spread
Unusual
Unusual
Unusual
DESCRIBING CENTRE
•
Direction (Positive vs Negative)
•
Form (Linear vs Non-Linear)
B
I
V
A
R
I
A
T
E
DESCRIBING SPREAD
•
STRENGTH
•
This is a global statement of how much variation you see in the data as you move through
the ages of the cars.
•
Strong: little variation in price as you move through the ages of cars
•
Moderate: moderate variation in price as you move through the ages of cars
•
Weak: A lot of variation in price as you move through the ages of cars
•
Contextually, the better an indicator of the y-value the x-variable is, the stronger the
relationship. For example:
•
Very strong (Often trivial):
Customers Served in an Hour vs Average Time Spent per Customer
•
Moderate: Customers served in a hour vs Experience
•
Weak: Customers Served in an Hour vs hours working per week
•
No Relationship: Customers Served in an Hour vs Height
B
I
V
A
R
I
A
T
E
DESCRIBING SPREAD
•
SCATTER
•
Is the variation consistent as we increase the age of a car (constant
scatter) or is there a reasonable difference? (non-constant scatter)
SO TO SUM UP
•
Strength:
amount of variation as we move along x
•
Scatter:
consistency in variation as we move along x
B
I
V
A
R
I
A
T
E
DESCRIBING SHAPE
•
SKEW/SYMETRY
(not assessed in NCEA curriculum)
B
I
V
A
R
I
A
T
E
DESCRIBING UNUSUAL FEATURES
•
OUTLIERS?
•
GROUPS?
•
GAPS?
B
I
V
A
R
I
A
T
E
T
I
M
E
S
E
R
I
E
S
T
I
M
E
S
E
R
I
E
S
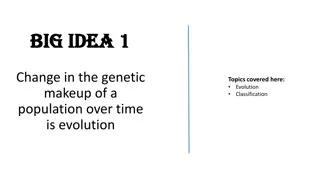
Trend
Seasonal
Relative Contributions (From Decomposition Graph)
Residuals
Centre
Spread
Spread
Unusual
DESCRIBING CENTRE
•
TREND
•
Changes in direction
T
I
M
E
S
E
R
I
E
S
DESCRIBING SPREAD
•
PEAK AND TROUGH OF RAW DATA
•
The extent of variability in y in (eg.) the last 10 years
•
SEASONAL VARIATION
•
Provides an idea of variation in y in a season.
•
Gives us a pattern to explore
•
Again, crucial for us to find explanations
•
RELATIVE CONTRIBUTION
•
Provides an idea of which component (Trend, Seasonal, Residual) contributes
more to variation in y.
T
I
M
E
S
E
R
I
E
S
DESCRIBING SHAPE
•
Not Applicable
T
I
M
E
S
E
R
I
E
S
DESCRIBING UNUSUAL FEATURES
•
RESIDUALS
T
I
M
E
S
E
R
I
E
S
VARIATION WHEN
CHOOSING A MODEL
H
O
W
S
H
O
U
L
D
T
H
E
I
D
E
A
L
S
T
A
T
S
S
T
U
D
E
N
T
D
E
A
L
W
I
T
H
V
A
R
I
A
T
I
O
N
?
We should try to quantify it and describe it meaningfully
We should try to seek explanations for it
When collecting data, we should control our processes so that
we don’t add to it unnecessarily (if this one isn’t attended to, it
can render all the above effort inaccurate)
We should not decide on the use of a model without
considering it
W
H
I
C
H
O
N
E
W
O
U
L
D
Y
O
U
M
O
D
E
L
W
I
T
H
A
N
O
R
M
A
L
D
I
S
T
R
I
B
U
T
I
O
N
?
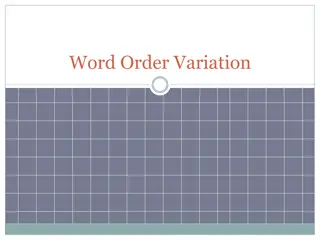
Very strong
evidence that this data is
not well modelled by a Normal
Distribution. Another distribution
should be considered
Reasonable
to assume the use of a
Normal Distribution for modelling
W
H
I
C
H
O
N
E
W
O
U
L
D
Y
O
U
M
O
D
E
L
W
I
T
H
A
N
O
R
M
A
L
D
I
S
T
R
I
B
U
T
I
O
N
?
Very strong
evidence that this data is
not well modelled by a Normal
Distribution. Another distribution
should be considered
Reasonable
to assume the use of a
Normal Distribution for modelling
At such a large sample size, even
small discrepencies from the
model are concerning
At such a small sample size, it’s only
natural that the shape of our
variable is yet to settle. It is only
logical at this sample size to have
some discrepancy from the model
RESEARCH
T
H
R
E
E
I
N
T
E
R
T
W
I
N
E
D
P
E
R
S
P
E
C
T
I
V
E
S
Research about variation suggests that individuals‘ reasoning about variation
can be captured from three perspectives
•
A Design Perspective
that integrates acknowledgement and
anticipation of variability in the design of studies
(usually surfaces in the “Plan” section of numerous standards)
•
A Data-Centric Perspective
that integrates the processes of
representing, measuring, and describing variation in exploratory data
analysis
(usually in the “Analysis” section of all standards)
•
Modeling Perspective
that integrates reasoning for fitting models to
patterns of variability in data and statistics, judging the fit of models
(usually in the Bivariate and Distributions standards)
(reference)
SOME OF THE KEY POINTS OF EMPHASIS
D
E
V
E
L
O
P
I
N
G
I
N
T
U
I
T
I
V
E
I
D
E
A
S
O
F
V
A
R
I
A
B
I
L
I
T
Y
•
Recognizing that variability is everywhere.
•
Some things vary just a little, some vary a lot.
•
We can try to understand why things vary
•
Considering data as an entity, rather than as
individual points.
D
E
S
C
R
I
B
I
N
G
A
N
D
R
E
P
R
E
S
E
N
T
I
N
G
V
A
R
I
A
B
I
L
I
T
Y
•
Graphs of data show how things vary and may reveal patterns to
help us focus on features of distributions and identify the signal in
the noise.
•
Different graphs may reveal different aspects of the variability in a
data set so it is important to study more than a single graph of a
data set.
•
Different numerical summaries tell us different things about the
spread of a data set.
U
S
I
N
G
V
A
R
I
A
B
I
L
I
T
Y
T
O
M
A
K
E
C
O
M
P
A
R
I
S
O
N
S
•
When making comparisons of two or more data sets,
examining their graphs on the same scale allows us to
compare the variability and speculate about why there are
differences in the data sets.
•
Advanced students should be introduced to the concept of
a distribution of means and understand it as the bases of
confidence interval construction
R
E
C
O
G
N
I
Z
I
N
G
V
A
R
I
A
B
I
L
I
T
Y
I
N
S
P
E
C
I
A
L
T
Y
P
E
S
O
F
D
I
S
T
R
I
B
U
T
I
O
N
S
•
In a normal distribution, the mean and SD provide
useful and specific information about variability.
•
There is variability in a bivariate data distribution,
and we need to consider the variability of both
variables as well as the variability for y values given
individual values of x.
I
D
E
N
T
I
F
Y
I
N
G
P
A
T
T
E
R
N
S
O
F
V
A
R
I
A
B
I
L
I
T
Y
I
N
F
I
T
T
I
N
G
M
O
D
E
L
S
•
There is variability involved in fitting models and judging the
fit of models (e.g., fitting the normal curve to a distribution
of data, or fitting a straight line to a scatterplot of bivariate
data).
•
The variability of the deviations from the model (residuals)
can tell us about the how well the model fits the data.
U
S
I
N
G
V
A
R
I
A
B
I
L
I
T
Y
T
O
P
R
E
D
I
C
T
R
A
N
D
O
M
S
A
M
P
L
E
S
O
R
O
U
T
C
O
M
E
S
•
Samples vary in some predictable ways, based on sample size and the
population from which they are drawn and how they are drawn. If we
have random samples the variability can be more readily explained and
described.
•
There is variability in outcomes of chance events.
C
O
N
S
I
D
E
R
I
N
G
V
A
R
I
A
B
I
L
I
T
Y
A
S
P
A
R
T
O
F
S
T
A
T
I
S
T
I
C
A
L
T
H
I
N
K
I
N
G
•
In statistical investigations, we always need to begin with examining and
discussing the variability of data.
•
Data production is designed with variation in mind.
•
In statistical analysis we try to explain variation by seeking the
systematic effects behind the random variability of individuals and
measurements (Moore, 1990).
•
The ideas listed above are all part of statistical thinking, and come into
play when exploring data and solving statistical problems (Wild &
Pfannkuch, 1999).
C
O
O
L
Q
U
O
T
E
F
R
O
M
R
E
S
E
R
C
H
•
Noise, that delightfully random bit of disorder that is present
everywhere, is an essential ingredient of our physical universe, to be
understood, appreciated and revered.
•
One has only to imagine a world without noise: the leaves of a plant
without variation of pattern, a stream without random gurglings, a
campfire without random flickerings. It’s a world without butterflies as
we know them, a world with both predictable weather and a
predictable stock market.
fin
This powerpoint reflects my personal journey
first thing we’re going to talk about is the students
Max:0:30
Variability is key in statistical studies, shaping the essence of statistical analysis. Students often struggle to grasp the concept of variability, despite being taught statistical methods. The term "variation" takes on different meanings in various statistical contexts, presenting challenges in comprehension. It is crucial to understand and appreciate the diverse manifestations of variation in data analysis to enhance statistical thinking skills.

Download Presentation

Please find below an Image/Link to download the presentation.
The content on the website is provided AS IS for your information and personal use only. It may not be sold, licensed, or shared on other websites without obtaining consent from the author.If you encounter any issues during the download, it is possible that the publisher has removed the file from their server.
You are allowed to download the files provided on this website for personal or commercial use, subject to the condition that they are used lawfully. All files are the property of their respective owners.
The content on the website is provided AS IS for your information and personal use only. It may not be sold, licensed, or shared on other websites without obtaining consent from the author.
E N D
Presentation Transcript
VARIATION THE HEART OF STATISTICAL STUDY
Variability is the heart and soul of the statistical endeavor. If it werent for the complexity of variability in data, statistics would be the past-time of middle-schoolers rather than one of the worlds leading scientific fields. STUDENTS NEED TO BE ABOUT VARIATION THINKING MORE Research shows that students find it hard to appreciate the role of variability, even when they are being taught to account and allow for it. Students have, from an early conception of statistical thinking, become very accustomed to being asked questions in data and chance that prompt them to respond with single point value answers. What is the Probability that .? How many would you expect? What is the average of ? These types of tasks in both research and assessment have tended to mask the issue of variability.
Questions like: STUDENTS NEED TO BE what is the probability of a year 12 student being taller than 170 cm? This question evokes a specific answer. There is a 34% Probability Students understand the meaning of their answer (or relatively so) ABOUT VARIATION THINKING MORE But when a student is told that Y12 boys have more variation in their data, they haven t a clue what that means They can calculate both IQRs They can tell you which IQR is bigger They ll even tell you that means boys heights have more variation. But they have no idea what that means
VARIATION, VARIATION, AND VARIATION
It seems like every time we teach stats, the word variation comes up in a different way. VARIATION, VARIATION, For example, in inference we say that sampling variability means that when I take another sample, I will get somewhat different results, etc. AND VARIATION But then in the analysis section, I say more variation has something to do with a bigger IQR And then in bivariate and experiments and others I m dealing with sources of variation , which certainly seems different to the other two? Many students think statisticians just like the word, and that s why it comes up under so many different contexts. But actually, we use the same word in so many different ways, because variation is a concept that has many manifestations.
It all comes from the same underlying idea Lets say we wanted to study boys heights. We know when we take 30 people s heights, that we re not going to keep getting the same number. There will be variation, There will be a variety of heights. VARIATION WITHIN SAMPLES One thing that contributes to that variety is VARIATIONWITHIN SAMPLE / SPREAD . This contributor is almost entirely a function of how the population behaves. i.e. if there is a lot of variation within heights of boys in the population, there will more than likely be lots of variation within heights of boys for the sample IT IS NOT DECREASED BY SAMPLE SIZE.
Another thing that contributes to that variety is VARIATION BETWEEN SAMPLES . VARIATION BETWEEN This is the idea that all samples are different, and it is by chance we picked this one. SAMPLES This contributes to the variability (variety) in the data. One cannot claim to know exactly whether in this particular sample it has contributed such and such amount. However, the amount of variation contributed by samples of the same size is largely predictable, and when considering descriptors such as mean/median, the extent of possible variation can be estimated by confidence interval construction.
Used in everyday teaching VARIATION BETWEEN VARIATIONWITHIN SAMPLES . Therefore the sample of boys heights has significantly more variation than the girls SAMPLES what we mean is: the boys heights have more variety than the girls. Could this be a mirror of the population? What would you expect? VARIATION BETWEEN SAMPLES . A sample of size 10 will have more variation than a sample of size 100 what we mean is: chance plays a more pivotal role in the look of you data with a sample of size 10 than if you had a sample of size 100
Another thing that contributes to that variety is VARIATION FROM NON SAMPLING ERRORS / SOURCES OFVARIATIONTHAT NEEDTO BE MANAGED VARIATION FROM NON SAMPLING ERRORS This is variation caused by factors of data collection that unduly affect the variety in that basket. Whether they increase the variety, or decrease it, both are equally problematic, because you as a scientist are making discoveries that are compromised.
We should try to quantify it and describe it meaningfully DEAL WITH VARIATION? IDEAL STATS STUDENT HOW SHOULD THE We should try to seek explanations for it When collecting data, we should control our processes so that we don t change it unnecessarily (if this one isn t attended to, it can render all the above effort inaccurate) We should not decide on the use of a model without considering it
VARIATION IN THE PLAN SECTION
We should try to quantify it and describe it meaningfully DEAL WITH VARIATION? IDEAL STATS STUDENT HOW SHOULD THE We should try to seek explanations for it When collecting data, we should control our processes so that we don t add to it unnecessarily (if this one isn t attended to, it can render all the above effort inaccurate) We should not decide on the use of a model without considering it
OF VARIATION MEAN ? MANAGING SOURCES WHAT DOES managing sources of variation : managing anything that might unduly increase or decrease or change in any other way the variation in our data.
In the plan section, the statistician should make every effort to manage sources of variation, possibly through: The application of correct statistical design in order to limit undue effects on data collection If sampling is involved, random sampling methods should be followed to limit undue effects caused by a biased/unrepresentative selection. If running a two independent group experiment, groups should be randomised to limit undue variation caused by unmatched groups. Etc. THE PLAN SECTION CONSIDERING VARIATION IN Expert statistician: Attempt to anticipate variation through researching results of similar studies completed previously. Decisions around design are often made based on anticipated variation. http://powerandsamplesize.com/
In 11 Bivariate, Some possible ideas include: STANDARDS THAT ALLOW MORE OPPORTUNITY TO MANAGE SOURCES OF how the measures are taken: where to start? Where to end? We should remove anything that would effect consistency of start point and end point. VARIATION How to make sure things are zeroed? (includes a tape measure, they could have a student other than the one measuring double check the tape measure s zero starts where it is meant to start) Inadequacy of equipment and how you will deal with it (weighing scale looks different from different angles, person taking measurement could stand in fixed position relative to scale) Remove any other barrier from consistency.
In Standards such as experiments, students should be encouraged to go beyond surface thinking to deeper thinking. STANDARDS THAT ALLOW MORE OPPORTUNITY TO MANAGE SOURCES OF I explain it like this. VARIATION Surface thinking: a person running your experiment would have considered that difficulty almost immediately, and come up with your method of dealing it with little thought Deeper thinking: only a person who has pondered deeply into the many aspects that could effect the results (contribute unduly to variation) would have thought of that difficulty and/or the way you dealt with it.
For example: Question: Does colour effect the number of words you can remember? STANDARDS THAT ALLOW MORE OPPORTUNITY TO MANAGE SOURCES OF Surface thinking: Every student will have the same amount of time to look at and memorise the words VARIATION Deeper thinking: I made sure the words chosen were from different topics and of different lengths. I was worried that if they were all from the same topic someone may find them easier to remember. For example, if most of them are sport related the sporty kids will find them a lot easier to memorise than the non-sporty kids
VARIATION IN THE ANALYSIS SECTION
We should try to quantify it and describe it meaningfully DEAL WITH VARIATION? IDEAL STATS STUDENT HOW SHOULD THE We should try to seek explanations for it When collecting data, we should control our processes so that we don t add to it unnecessarily (if this one isn t attended to, it can render all the above effort inaccurate) We should not decide on the use of a model without considering it
I think it is superior for a student to think of data as a story of variation from which we extract measures of centre, than for a student to think of data through it s centre and consider variability around that centre. So, I think it would be superior for a student to acknowledge the statistical endeavour as an attempt to consider variation of the data, and that: One facet of this, is to extract the central tendency from the variation in the data. (CENTRE) Another facet, is to describe how much variation there is in the data (SPREAD) Another facet, is to describe the pattern of that variation (SHAPE) Another facet, is to describe unusual aspects of the variation. (UNUSUAL)
DESCRIBING CENTRE Description of INFERENCE Mean Median Difference in mean/median Shift of middle 50% Etc.
DESCRIBING SPREAD RANGE o A measure of the extent of variation. What is the extent of varitey in the sample of heights? IQR o A measure of typical variation, or, the variation of the generality of sample points. INFERENCE eg. Everyone greater than the upper quartile can be thought of as taller people . Everyone lower than the lower quartile can be thought of as shorter people . All the people in the IQR could be thought of as the general case of heights. Therefore, spread of IQR is a good measure of the amount of variety of heights amongst the more typical boys. STANDARD DEVIATION o Again, a measure of typical variation. Generally, the standard deviation is favoured as the measure of typical variation in more symmetrical data, and IQR is favoured as measure of typical variation in skewed data. To make a comparative statement about which group (eg. Boys or Girls) have more spread: It is superior to use typical measures of spread when making this decision
DESCRIBING SHAPE SKEW/SYMETRY INFERENCE Indicates where the majority of the data lies, students should ponder why that is. Indicates if there is a tail, students should ponder why that is. UNIMODAL/BIMODAL If a dataset truly is bimodal, it could indicate groups within the data. However, students seem to struggle to understand the difference between a unimodal dataset with two towers in and around the peak, compared with truly bimodal data.
DESCRIBING UNUSUAL FEATURES OUTLIERS? (Why?) INFERENCE GAPS? (Why?)
Direction (Positive vs Negative) Centre Centre Form(Linear vs Non-Linear) Spread Strength BIVARIATE Spread Scatter (increasing/decreasing/consistent?) Groupings Unusual Unusual Outliers Unusual Gaps
DESCRIBING CENTRE Direction (Positive vs Negative) Form (Linear vs Non-Linear) BIVARIATE
DESCRIBING SPREAD STRENGTH This is a global statement of how much variation you see in the data as you move through the ages of the cars. Strong: little variation in price as you move through the ages of cars BIVARIATE Moderate: moderate variation in price as you move through the ages of cars Weak: A lot of variation in price as you move through the ages of cars Contextually, the better an indicator of the y-value the x-variable is, the stronger the relationship. For example: Very strong (Often trivial): Customers Served in an Hour vs Average Time Spent per Customer Moderate: Customers served in a hour vs Experience Weak: Customers Served in an Hour vs hours working per week No Relationship: Customers Served in an Hour vs Height
DESCRIBING SPREAD SCATTER Is the variation consistent as we increase the age of a car (constant scatter) or is there a reasonable difference? (non-constant scatter) BIVARIATE SO TO SUM UP Strength: amount of variation as we move along x Scatter: consistency in variation as we move along x
DESCRIBING SHAPE SKEW/SYMETRY (not assessed in NCEA curriculum) BIVARIATE
DESCRIBING UNUSUAL FEATURES OUTLIERS? BIVARIATE GROUPS? GAPS?
Centre Trend Seasonal Spread TIME SERIES Spread Relative Contributions (From Decomposition Graph) Unusual Residuals
DESCRIBING CENTRE TREND Changes in direction TIME SERIES
DESCRIBING SPREAD PEAK AND TROUGH OF RAW DATA The extent of variability in y in (eg.) the last 10 years TIME SERIES SEASONAL VARIATION Provides an idea of variation in y in a season. Gives us a pattern to explore Again, crucial for us to find explanations RELATIVE CONTRIBUTION Provides an idea of which component (Trend, Seasonal, Residual) contributes more to variation in y.
DESCRIBING SHAPE Not Applicable TIME SERIES
DESCRIBING UNUSUAL FEATURES RESIDUALS TIME SERIES
VARIATION WHEN CHOOSING A MODEL
We should try to quantify it and describe it meaningfully DEAL WITH VARIATION? IDEAL STATS STUDENT HOW SHOULD THE We should try to seek explanations for it When collecting data, we should control our processes so that we don t add to it unnecessarily (if this one isn t attended to, it can render all the above effort inaccurate) We should not decide on the use of a model without considering it
Very strong evidence that this data is not well modelled by a Normal Distribution. Another distribution should be considered Reasonable to assume the use of a Normal Distribution for modelling WHICH ONE WOULD YOU MODEL WITH A NORMAL DISTRIBUTION?
Very strong evidence that this data is not well modelled by a Normal Distribution. Another distribution should be considered Reasonable to assume the use of a Normal Distribution for modelling WHICH ONE WOULD YOU MODEL WITH A NORMAL DISTRIBUTION? At such a small sample size, it s only natural that the shape of our variable is yet to settle. It is only logical at this sample size to have some discrepancy from the model At such a large sample size, even small discrepencies from the model are concerning
Research about variation suggests that individuals reasoning about variation can be captured from three perspectives THREE INTERTWINED A DESIGN PERSPECTIVEthat integrates acknowledgement and anticipation of variability in the design of studies (usually surfaces in the Plan section of numerous standards) PERSPECTIVES A DATA-CENTRIC PERSPECTIVEthat integrates the processes of representing, measuring, and describing variation in exploratory data analysis (usually in the Analysis section of all standards) MODELING PERSPECTIVEthat integrates reasoning for fitting models to patterns of variability in data and statistics, judging the fit of models (usually in the Bivariate and Distributions standards) (reference)
Recognizing that variability is everywhere. DEVELOPING INTUITIVE IDEAS OF VARIABILITY Some things vary just a little, some vary a lot. We can try to understand why things vary Considering data as an entity, rather than as individual points.
Graphs of data show how things vary and may reveal patterns to help us focus on features of distributions and identify the signal in the noise. DESCRIBING AND REPRESENTING VARIABILITY Different graphs may reveal different aspects of the variability in a data set so it is important to study more than a single graph of a data set. Different numerical summaries tell us different things about the spread of a data set.
When making comparisons of two or more data sets, examining their graphs on the same scale allows us to compare the variability and speculate about why there are differences in the data sets. USING VARIABILITY TO MAKE COMPARISONS Advanced students should be introduced to the concept of a distribution of means and understand it as the bases of confidence interval construction
In a normal distribution, the mean and SD provide useful and specific information about variability. TYPES OF DISTRIBUTIONS VARIABILITY IN SPECIAL RECOGNIZING There is variability in a bivariate data distribution, and we need to consider the variability of both variables as well as the variability for y values given individual values of x.
There is variability involved in fitting models and judging the fit of models (e.g., fitting the normal curve to a distribution of data, or fitting a straight line to a scatterplot of bivariate data). IDENTIFYING PATTERNS OF VARIABILITY IN FITTING MODELS The variability of the deviations from the model (residuals) can tell us about the how well the model fits the data.


")