Direct Variation in Math
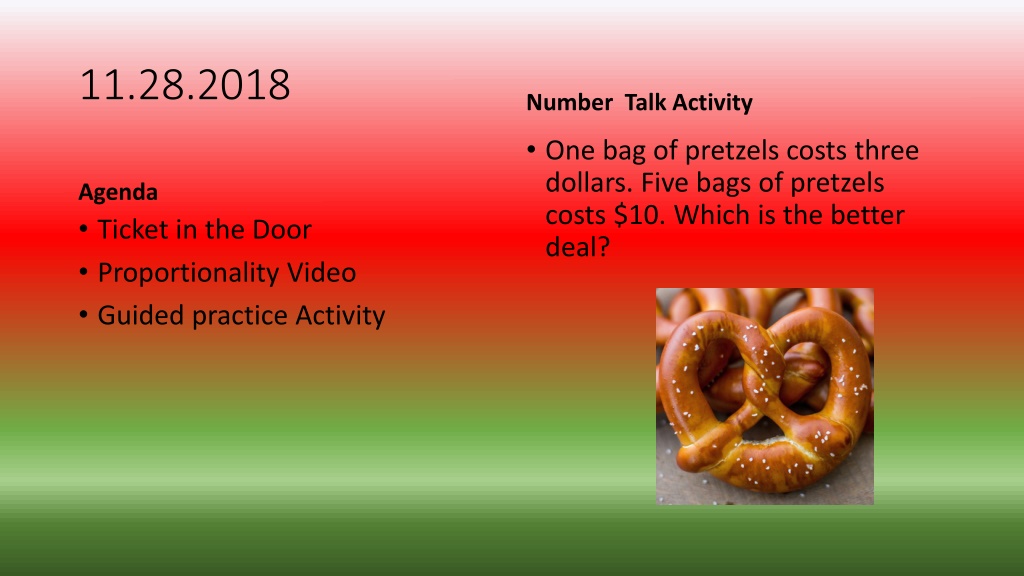

11.28.2018
Agenda
•
Ticket in the Door
•
Proportionality Video
•
Guided practice Activity
Number Talk Activity
•
One bag of pretzels costs three
dollars. Five bags of pretzels
costs $10. Which is the better
deal?

Review Video
•
https://www.youtube.com/watch?v=Cbge4teixr0
Brainstorm: List
anything
you notice about
the table of data.
Vocabulary
Constant of Proportionality
- a constant ratio (unit rate) in any
proportional relationship.
Is this a proportional relationship?
Is there a Constant of Proportionality?
Is this a proportional relationship?
Is there a Constant of Proportionality?
Vocabulary
Which tables show a direct variation? Give the constant of proportionality, if possible.
Time to practice!
•
Determine if each relationship show Direct Variation
•
If possible, find the Constant of Proportionality
•
Complete the sentence interpret your answer.
Brainstorm:
•
What does a relationship that is proportional look like on a graph?
•
How is the Constant of Proportionality (Unit Rate) involved?
Let’s see!
Write each ratio as an ordered pair.
Plot your ordered pairs.
What do you notice?
Summarize
•
What does a relationship that is proportional look like on a graph?
•
How is the Constant of Proportionality (Unit Rate) involved?
Time to practice!
•
Find the Constant of Proportionality on the following graphs.
https://www.mathworksheets4kids.com/proportion/constant/table-
1.pdf
Reference
•
www.campbell.k12.ky.us/userfiles/1718/.../Constant%20of%20Propo
rtionality.pptx
Explore the concept of direct variation in math through an analysis of proportional relationships, constants of proportionality, and graph representation. Practice identifying direct variation and determining the constant of proportionality to interpret the data effectively.

Download Presentation

Please find below an Image/Link to download the presentation.
The content on the website is provided AS IS for your information and personal use only. It may not be sold, licensed, or shared on other websites without obtaining consent from the author.If you encounter any issues during the download, it is possible that the publisher has removed the file from their server.
You are allowed to download the files provided on this website for personal or commercial use, subject to the condition that they are used lawfully. All files are the property of their respective owners.
The content on the website is provided AS IS for your information and personal use only. It may not be sold, licensed, or shared on other websites without obtaining consent from the author.
E N D
Presentation Transcript
11.28.2018 Number Talk Activity One bag of pretzels costs three dollars. Five bags of pretzels costs $10. Which is the better deal? Agenda Ticket in the Door Proportionality Video Guided practice Activity
Review Video https://www.youtube.com/watch?v=Cbge4teixr0
Brainstorm: List anything you notice about the table of data.
Vocabulary Constant of Proportionality - a constant ratio (unit rate) in any proportional relationship.
Is this a proportional relationship? Is there a Constant of Proportionality?
Is this a proportional relationship? Is there a Constant of Proportionality?
Vocabulary Relationships that have a positive proportional relationship are said to have Direct Variation or Vary Directly Direct Variation the ratio of output and input (? ?) is constant (proportional). The constant ratio is called the Constant of Proportionality
Which tables show a direct variation? Give the constant of proportionality, if possible.
Time to practice! Determine if each relationship show Direct Variation If possible, find the Constant of Proportionality Complete the sentence interpret your answer.
Brainstorm: What does a relationship that is proportional look like on a graph? How is the Constant of Proportionality (Unit Rate) involved?
Lets see! Write each ratio as an ordered pair. Plot your ordered pairs. What do you notice?
Summarize What does a relationship that is proportional look like on a graph? How is the Constant of Proportionality (Unit Rate) involved?
Time to practice! Find the Constant of Proportionality on the following graphs. https://www.mathworksheets4kids.com/proportion/constant/table- 1.pdf
Reference www.campbell.k12.ky.us/userfiles/1718/.../Constant%20of%20Propo rtionality.pptx