Common Cause Variation in Sampling and Process Monitoring
Common cause variation is inherent to a process and represents background noise that can obscure signals of special cause variation. Sampling plans and rational subgrouping help estimate and manage common cause variation in quantitative data. Estimating common cause involves assessing variation within subgroups using sample standard deviations or ranges. Rational subgrouping ensures that special cause variation appears between subgroups rather than within them.

Download Presentation

Please find below an Image/Link to download the presentation.
The content on the website is provided AS IS for your information and personal use only. It may not be sold, licensed, or shared on other websites without obtaining consent from the author.If you encounter any issues during the download, it is possible that the publisher has removed the file from their server.
You are allowed to download the files provided on this website for personal or commercial use, subject to the condition that they are used lawfully. All files are the property of their respective owners.
The content on the website is provided AS IS for your information and personal use only. It may not be sold, licensed, or shared on other websites without obtaining consent from the author.
E N D
Presentation Transcript
Attributes of Common Cause Variation It is the variation inherent to a Process. It cannot be reduced unless one changes the Process. It can be considered to be the background noise present in a Process. It can obscure signals of Special Cause Variation. It can be estimated Statistically. Estimates of Common Cause are derived from Sampling Plans. 2
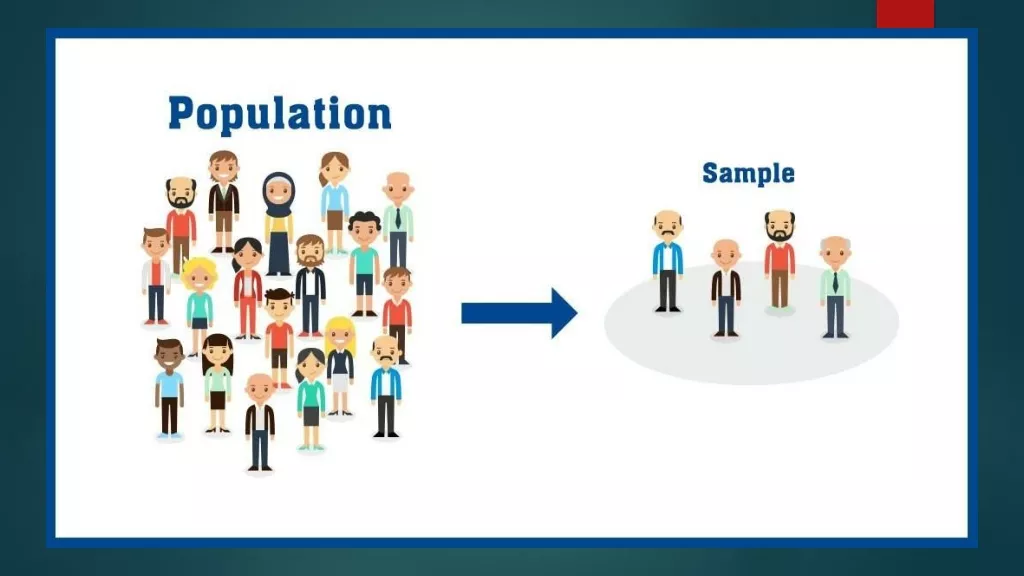
What is a Sampling Plan? A protocol for collecting samples which we typically refer to as subgroups (i=1, ,k). The sampling protocol tells us how to select items for each sample (examples: random sampling, stratified random sampling, periodic sampling such as every 100 items, etc.) A protocol for measuring one or more characteristics of the items in the samples. The measurement protocol tells us what type of characteristic (quantitative or qualitative) is to be measured and how. The Sampling Plan will determine what we think Common Cause Variation is, i.e. within subgroup variation. 3
Rational Subgrouping Plans Sampling plans should be based upon Rational Subgrouping. Rational Subgrouping minimizes the chance that Special Cause variation occurs within the subgroups. Rational Subgrouping maximizes the chance that Special Cause variation will be detected between subgroups. 4
Rational Subgrouping should assure Special Cause variation should appear in the X-bar chart as between subgroup variation. Special Cause should not appear in an R-chart if within subgroup variation truly reflects Common Cause. 5
Estimating Common Cause for quantitative data. Common Cause Variation (or just Common Cause) is denoted . It is an estimate of Common Cause variation within the subgroups in terms of the standard deviation of the within subgroup variation. It is assumed that within subgroup variation is homogeneous (important assumption). For within subgroup variation to reflect Common Cause, the process must be sampled under the most homogeneous operating conditions possible, i.e. Rational Subgrouping. c 6
Estimating Common Cause Common Cause, c , is estimated by either using the sample standard deviations or the ranges of the data in the subgroups. k s k c i = 1 i or where R-bar is the average of the Ranges of each of the subgroups and d2 is a constant. R d 2 c 7
Common Cause of Subgroup Averages If Then the standard deviation of X-bar is 8
Then 99% of the time Our Subgroup means should be within three times of Which should be our approximate Process Mean. 9
Estimates of Common Cause are used to: Monitor the process for consistency of within subgroup variation using an R-bar or s chart. Monitor the process for signals of special cause when making comparisons between subgroup (shifts in the mean) using an X-bar chart. Comparing the process performance to specifications, for example, tolerance. This is done with a Capability study. Setting targets for future performance, for example, Six Sigma. 10
Questions: What does a sampling protocol do? What does a measurement protocol do? Is Common Cause signal or noise? Does our sampling plan actually tell us what Common Cause actually is? What measures of variation do we use to estimate Common Cause? What is the estimate of Common Cause actually useful for? 11