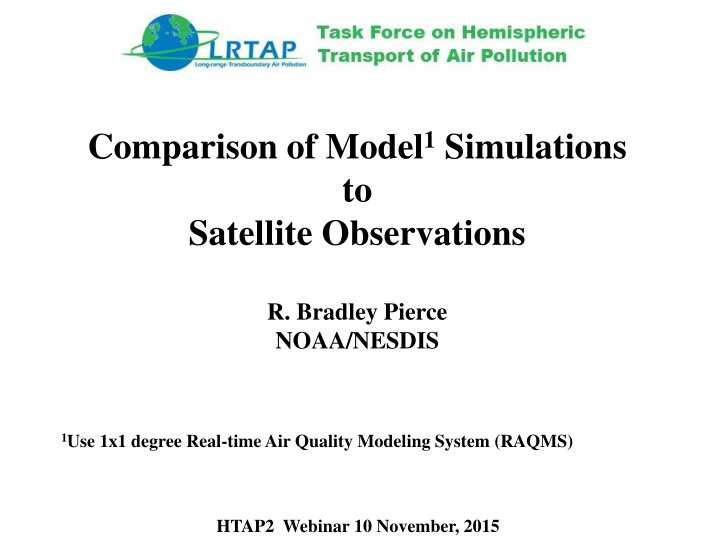
Comparison of Model 1 Simulations to Satellite Observations for July 1, 2010
Explore the comparison of Model 1 simulations with various satellite measurements such as AIRS, OMI, CloudSat, and CALIPSO for July 1, 2010. Focus on OMI Tropospheric NO2 data and factors impacting the tropospheric NO2 column retrieval.

Download Presentation

Please find below an Image/Link to download the presentation.
The content on the website is provided AS IS for your information and personal use only. It may not be sold, licensed, or shared on other websites without obtaining consent from the author.If you encounter any issues during the download, it is possible that the publisher has removed the file from their server.
You are allowed to download the files provided on this website for personal or commercial use, subject to the condition that they are used lawfully. All files are the property of their respective owners.
The content on the website is provided AS IS for your information and personal use only. It may not be sold, licensed, or shared on other websites without obtaining consent from the author.
E N D
Presentation Transcript
Comparison of Model1 Simulations to Satellite Observations R. Bradley Pierce NOAA/NESDIS 1Use 1x1 degree Real-time Air Quality Modeling System (RAQMS) HTAP2 Webinar 10 November, 2015
Consider three different Satellite measurements: Atmospheric Infrared Sounder (AIRS) Carbon Monoxide (Collection 6) Ozone Monitoring Instrument (OMI) Tropospheric NO2 (Version 3) CloudSat and the Cloud-Aerosol Lidar and Infrared Pathfinder Satellite Observation (CALIPSO) aerosol extinction profile (Version 3) Focus on July 1, 2010 to demonstrate approach
OMI Tropospheric NO2 (Version 3) OMI Orbits between 00-3.5Z on July 01, 2010 OMI Tropospheric NO2 Column Swath is 13x24 km (at nadir)
OMI Tropospheric NO2 (Version 3) Latitudes >+/-25o have swath overlap OMI Orbits between 00-3.5Z on July 01, 2010 Single local time (i.e. 1:00pm) will not capture multiple observations/day north of +/-25o OMI Tropospheric NO2 Column Swath is 13x24 km (at nadir)
The OMI Slant Column Amount (S) is the retrieved total NO2 slant column and is the total areal density of NO2 molecules along the effective optical path from the sun into the atmosphere, and then toward the satellite. The OMI Tropospheric NO2 Column Amount NO2 estimates of the tropospheric vertical column (V) derived from S. The OMI Scattering Weight (A) is a vector that describes the relationship between slant Column (Si) and the vertical column (Vi) for each atmospheric layer. The OMI Air Mass Factor (AMF) accounts for assumed NO2 profile shape, cloud fraction, viewing angles, reflectivity, and topography. To calculate the model tropospheric NO2 column (with AMF) one integrates the model no2 profile, weighted by the scattering weight, from the surface to the tropopause and then divides by the tropospheric airmass factor: Modno2amf =modno2amf+modsctwt(l)*dpprof(l)*no2prof(l)*fac/omi_amftrop
OMI Cloud Radiance Fraction on July 01, 2010. Recommend limiting cloud radiance fraction to <30% for tropospheric NO2 retrievals.
Version 6.0 AIRS Carbon Monoxide July 01, 2010 AIRS product granules contain 6 minutes of data. There are nominally 240 Level 1B and 240 Level 2 granules of 6-minute duration generated each day. AIRS CO retrieved at 45km (at nadir) horizontal resolution with an accuracy of 15%
Version 6.0 AIRS Carbon Monoxide July 01, 2010 Latitudes >+/-45o have swath overlap AIRS product granules contain 6 minutes of data. There are nominally 240 Level 1B and 240 Level 2 granules of 6-minute duration generated each day. AIRS CO retrieved at 45km (at nadir) horizontal resolution with an accuracy of 15%
Need to apply the AIRS Averaging Kernels (AK) to enable convolution of model profile with apriori1 to account for smoothing errors in AIRS retrieval process. The convolution can be performed two ways: 1) By coarse layer averaging the truth, retrieval, and a priori profiles on the retrieval grid. This is an approximation and does not account for the fact that the retrieval algorithm does not allow the retrieved profile to move in non- trapezoidal shapes. convolve the "truth" with the averaging kernel the equation is : ln( co' ) = ln(co_apriori) + A * ln(cotrue / co_apriori) 2) As prescribed in Maddy and Barnet, IEEE TGRS, 2008 (MB08) convert the profile to coarse slab values using the effective averaging kernel (Equation 11 MB08). The second way is more accurate (Eric S. Maddy, personnel communication) convolve the "truth" with the averaging kernel the equation is : ln( co' ) = ln(co_apriori) + F*A*Finv * ln(cotrue / co_apriori) 1AIRS V6 CO has monthly NH and SH apriori profiles
AIRS CO column Daytime (Descending) orbit July 01, 2010 2.0 1.0 1.5 2.5 0.0 1018 mol/cm2
RAQMS significantly overestimates AIRS CO over Brazzaville, even with AK applied AIRS CO retrieval is unable to capture high surface CO and high upper tropospheric CO due to lack of upper tropospheric and lower tropospheric sensitivity
More accurate Coarse Layer profiles capture more of high upper tropospheric CO Coarse layer profiles AIRS CO retrieval is unable to capture high surface CO and high upper tropospheric CO due to lack of upper tropospheric and lower tropospheric sensitivity Fine layer profiles
RAQMS slightly overestimates AIRS CO over Beijing with AK applied AIRS CO retrieval is unable to capture high surface CO lower tropospheric sensitivity
AIRS CO column Daytime (Descending) orbit July 01, 2010 2.0 1.0 1.5 2.5 0.0 1018 mol/cm2
RAQMS (AK applied) CO column Daytime (Descending) orbit July 01, 2010 2.0 1.0 1.5 2.5 0.0 1018 mol/cm2
Version 3.00 of the CALIOP Level 2 Aerosol Profile product July 01, 2010 July 01, 2010 data availability only 48.2% due to XBAND Data loss between 06/30/10 22:27:52 and 07/01/10 13:17:46 due to ground station anomaly
Version 3.00 of the CALIOP Level 2 Aerosol Profile product July 01, 2010 Latitudes >+/-70o have orbit overlap July 01, 2010 data availability only 48.2% due to XBAND Data loss between 06/30/10 22:27:52 and 07/01/10 13:17:46 due to ground station anomaly
CALIPSO V3 Quality Flags Bit Value Interpretation 1 0 unconstrained retrieval; initial lidar ratio unchanged during solution process 1 1 constrained retrieval 2 2 Initial lidar ratio reduced to prevent divergence of extinction solution 3 4 Initial lidar ratio increased to reduce the number of negative extinction coefficients in the derived solution 4 8 Calculated backscatter coefficient exceeds the maximum allowable value 5 16 Layer being analyzed has been identified by the feature finder as being totally attenuating (i.e., opaque) 6 32 Estimated optical depth error exceeds the maximum allowable value 7 64 Solution converges, but with an unacceptably large number of negative values 8 128 Retrieval terminated at maximum iterations 9 256 No solution possible within allowable lidar ratio bounds 16 32768 Fill value or no solution attempted
RAQMS CO column Daytime (Descending) orbit July 01, 2010 RAQMS 14Z Daytime Extinction July 01, 2010
AIRS CO column Daytime (Descending) orbit July 01, 2010 CALIPSO 14Z Daytime Extinction July 01, 2010
Conclusions and Discussion points Care must be taken to account for cloud clearing, apriori assumptions, and retrieval sensitivity to use satellite retrievals for model evaluations Recommend that HTAP modeling groups map daily model profiles to L2 (orbital) geolocation (latitude, longitude, and GMT) to avoid issues with overlapping swaths Willing to provide HTAP with simple ascii, comma delimitated L2 files with AIRS, OMI, and CALIPSO geolocation for January and July 2010 for testing Modelers return model CO, NO2, aerosol extinction, surface pressure, and pressure profiles on model levels. Interpolation, application of AIRS Averaging Kernels and OMI Scattering Weights, and column integration is CPU intensive. Need to consider where to perform this step (RSIG?)


")
")
 is the retrieved total NO2")


 Tropospheric NO2 column on July 01, 2010.")
 Tropospheric NO2 column on July 01, 2010.")


 to enable")
 orbit July 01, 2010")


 orbit July 01, 2010")
 CO column Daytime (Descending) orbit July")


 orbit July 01, 2010")
 orbit July 01, 2010")