Evaluation of SPLASH and HRRR Soil Moisture Comparison
This study compares soil moisture data between the HRRR model and SPLASH observations during the 2022 warm season. It explores differences in soil moisture levels at various depths, evaluates responses to precipitation events, and drydown periods. The research focuses on analyzed data from HRRR Model and SPLASH Observations, describing the model's soil levels and observation methods. It also includes information on the location of observations, soil characteristics at specific sites, and the instruments used for data collection.
Download Presentation

Please find below an Image/Link to download the presentation.
The content on the website is provided AS IS for your information and personal use only. It may not be sold, licensed, or shared on other websites without obtaining consent from the author.If you encounter any issues during the download, it is possible that the publisher has removed the file from their server.
You are allowed to download the files provided on this website for personal or commercial use, subject to the condition that they are used lawfully. All files are the property of their respective owners.
The content on the website is provided AS IS for your information and personal use only. It may not be sold, licensed, or shared on other websites without obtaining consent from the author.
E N D
Presentation Transcript
Evaluation of SPLASH-observed and HRRR Soil Moisture Darren Jackson (CIRES/PSL) Tanya Smirnova (GSL), Mimi Hughes (PSL), Kelly Mahoney (PSL), and Janet Intrieri (PSL) S3 Workshop November 1, 2023
Introduction Examine 2022 warm season (May October) soil moisture and precipitation between the HRRR model and SPLASH observations Show model and observation differences in soil moisture at various depths from 0 - 50 cm Evaluate observation and soil moisture response to summer precipitation events and drydown periods
Observation and Model Data Background HRRR Model SPLASH Observations HRRRv4 with the RUC LSM land surface model that has 9 soil levels ARL and PSL sites use SoilVUE 50 cm probes with soil moisture and temperature observations at 5, 10, 20, 30, 40, 50 cm Model levels of 0, 1, 4, 10, 30, 60 cm interpolated to SoilVUE and HydraProbe levels used at SPLASH and SNOTEL sites SNOTEL sites use Stevens HydraProbe that have soil moisture data at 2, 8, 20 in (~ 5, 20, 50 cm) All data acquired from 1-hour forecast data. Focus is on analyzed fields rather than forecasted fields. UAS observations and handheld probe data of soil moisture at ~ 5 cm Precipitation gauge data available from ARL at Kettle Ponds and SNOTEL at Butte and Schofield Pass sites * All measurements were average to hourly data
Location of SPLASH Observations and HRRR Grid Cells Map (left) shows the SPLASH domain and locations of soil moisture observations Map (top) shows the 3-km HRRR grid cells collocated with SPLASH sites KP1 has not the nearest grid to Kettle Ponds but likely better represents the land surface conditions in the East River valley at Kettle Ponds
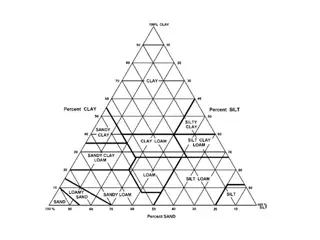
Soil Characteristics at Avery Picnic and Kettle Ponds CSU Laboratory Tested Soil Samples Sample Depth (in) Soil Texture (%) Soil Type Sand Silt Clay AYP 2 40 35 25 Loam KPA 2 35 42 22 Loam KEP1 2 43 35 22 Loam * HRRR grid cells at Avery Picnic and Kettle Ponds are assigned as loam Soil Characteristics for Loam Soils Porosity (m3/m3) Source Field Capacity Wilting Point HRRR 0.451 0.314 0.137 Saxton and Rawls (2006) 0.46 0.28 0.14 Dingman (2002) 0.42-0.47 0.18-0.27 0.08
2022 Seasonal Accumulated Precipitation Observed accumulated precipitation exceeds HRRR accumulated precipitation at three SPLASH locations HRRRv4 has known dry bias due to its ensemble data assimilation plus the impact of precipitation spin up over 1-hour forecast period that drives the evolution of soil moisture
Seasonal 5 cm Soil Moisture Variability Loam Porosity Observations have greater variability after precipitation and the following drydown HRRRs drydown rate during dry periods less than observations SoilVUE near-surface soil moisture retrievals have a known dry bias (Wilson et al. 2022)
Seasonal 50 cm Soil Moisture Variability Observations are wetter in the snowmelt period at AP and KP due to less SWE in HRRR model at these locations HRRR internal deep soil moisture climatology has been modified over past 15 years and this comparison indicates good agreement for AP and KP
Seasonal 0-50 cm Soil Moisture Comparison Loam Porosity Observations have a greater vertical gradient than HRRR particularly during snowmelt period and early summer Observation and HRRR 20-50 cm soil moisture tend to converge by end of October 5 and 10 cm observed soil moisture generally drier than HRRR except during rainfall periods
5 cm Soil Moisture Comparison with UAS and Probe Data UAS observations agree well in June and July with HRRR and ARL SoilVUE 5 cm soil moisture but have larger departures in September and October Probe area mean (green) agree well with HRRR and Probe data near KPA (magenta) agree well with KPA SoilVUE. SoilVUE locations at KP and AP are located in relatively drier soils. Probe Drydown rate in June is consistent with SoilVUE observations.
July 23-31, 2022 Rainfall Event at Kettle Ponds HRRR multi-day accumulated precipitation in better agreement for this event than most 2022 summer events HRRR HRRR near-surface (0-20 cm) soil moisture response evident on July 25th and 29th Observational response more gradual but overall increase of 0.1 m3/m3 at 5 cm similar between model and observations More vertical gradient in soil moisture at depth in observations ARL-KPB
SUMMARY HRRR precipitation is less than observations which likely impacts the smaller near-surface soil moisture response relative to observations. HRRR soil moisture near the surface is wetter than observations and drier than observations at depth particularly during snowmelt and early summer period. HRRR demonstrated it can have a multi-day increase in soil moisture similar to observations during multi-day precipitation event. Next Step: Evaluating HRRR and observational surface fluxes may help explain differing soil moisture drydown rates between HRRR and observations.
