Clark College Strategic Enrollment Management & Guided Pathways Impact
Clark College is implementing a College-wide Strategic Enrollment Management Plan and Guided Pathways to enhance student achievement. The plan aims to stabilize and increase enrollment, improve retention rates, reduce equity gaps, and enhance student success outcomes. The college is also prioritizing racial equity, identifying barriers, and implementing practices for historically underrepresented groups. The focus is on achieving equitable outcomes for all students and employees through data-driven decision-making and student-centered experiences.
Download Presentation

Please find below an Image/Link to download the presentation.
The content on the website is provided AS IS for your information and personal use only. It may not be sold, licensed, or shared on other websites without obtaining consent from the author.If you encounter any issues during the download, it is possible that the publisher has removed the file from their server.
You are allowed to download the files provided on this website for personal or commercial use, subject to the condition that they are used lawfully. All files are the property of their respective owners.
The content on the website is provided AS IS for your information and personal use only. It may not be sold, licensed, or shared on other websites without obtaining consent from the author.
E N D
Presentation Transcript
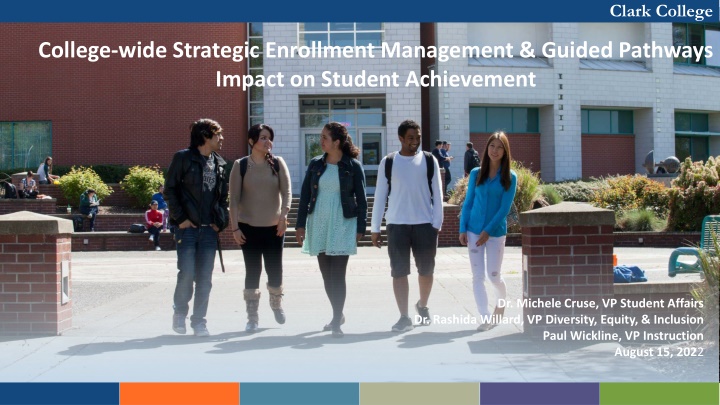
Clark College College-wide Strategic Enrollment Management & Guided Pathways Impact on Student Achievement Dr. Michele Cruse, VP Student Affairs Dr. Rashida Willard, VP Diversity, Equity, & Inclusion Paul Wickline, VP Instruction August 15, 2022
Clark College Cruse/Wickline Overview Equity & Student Centered CWSEM & Guided Pathways on Student Achievement Goals College-wide Strategic Enrollment Management Plan (CWSEM) 2021 - 2024 Guided Pathways Stabilize & Increase Enrollment by 5% Pathway Design *Outcomes Alignment and Scheduling Increase Retention by 10% Student Experience *Intake and Student Engagement Reduce Equity Gaps by 50% Equity Focused Professional Development Increase student success outcomes by 5% *Transfer, degree attainment, living wage jobs Building our Data Infrastructure Increase holistic program & supports @ CTC & CCW by 5%
Clark College Willard Advancing Justice Clark College leads with racial equity as a holistic approach to identify barriers & best practices relating to the enrollment, retention, & completion of historically underrepresented racial and ethnic groups. Using data to guide us, we proactively seek out best practices and eliminate barriers to ensure equitable outcomes for students and employees.
Clark College Willard CWSEM & Guided Pathways CWSEM: 3 -year plan that leads with social equity to achieve a 5% increase in enrollment to identify, recruit, enroll, retain, close equity gaps, and graduate the student body. Guided Pathways College-wide effort to identify and close equity gaps by ensuring a transparent and student-centered structured experience for students that contributes to student's academic success or obtainment of career/living wage jobs.
Clark College Cruse Stabilize & Increase Enrollment by 5% By 2024, increase prospect pool by 20%, increase conversion from prospect to applicant by 10%, increase applicant to enroll students by 5%, and experience flat enrollment. Prospect Pool 20% Prospect Conversion 10% Applicant to Enrollment - 5%
Clark College Cruse Stabilize & Increase Enrollment by 5% Highlights Strategies/Outcomes Implemented comprehensiveprospective student recruitment & marketing strategies that included outreach, activities, & programs focus on recruitment & enrollment HUSOC RS students Created systems & models (data and processes) to support enrollment management; including student-facing systems/services, regular data reviews, & process mapping Increased outreach & recruitment efforts - Transitional Studies students Developed & implemented placement prep Math boot camp offered with a condensed COLL101 in Summer Streamlined Running Start Enrollment Process: High schools, families, & CTE programs. Received ESSER (Elementary and Secondary School Emergency Relief) funding through OSPI & SBCTC to provide approx. 300 Summer 2022 Running Start tuition for Running Start enrollments in Career and Technical Programs & during Academic Year 2022-2023
Clark College Cruse Stabilize & Increase Enrollment by 5% Benchmark Comparison with Similar Colleges Benchmarking our student achievement efforts is conducted with five (5) colleges within the Washington Community and Technical Colleges (CTC) system, based on size of institution, program offerings, and student demographics (see Table X). The Washington State Board for Community and Technical Colleges (SBCTC) compiles dashboards to allow comparison with our benchmark colleges, including enrollment, student progression, and post-completion outcomes. Comparison of Clark College student achievement data with benchmark colleges is available in the Appendix. Table X. Enrollment and Demographics for Clark College and Benchmark Colleges. Academic Year 2020-2021. Edmonds College 6,158 13,397 50% 54% 39% 19% 10% 40% 34% 14% Green River College 7,785 14,081 44% 50% 55% 19% 16% 45% 29% 9% Highline College 6,674 13,139 67% 62% 38% 32% 11% 45% 22% 29% Bellevue College* 11,412 22,297 49% 56% 47% 8% 10% 44% 33% 8% South Seattle College 4,083 9,793 44% 36% 35% 17% 5% 29% 50% 7% Clark College FTES Headcount % Student of Color % Female % Full Time % Need Based Aid % Running Start % Transfer Intent % CTE Intent % Adult Basic Ed 6,242 12,159 29% 55% 50% 28% 19% 56% 24% 8% DATA SOURCE: State Board for Community and Technical Colleges (SBCTC) Enrollment Data Dashboard. *Bellevue College is included for history as its program mix and size used to be comparable to Clark.
Clark College Cruse Stabilize & Increase Enrollment by 5% Benchmark Comparison with Similar Colleges Benchmarking our student achievement efforts is conducted with five (5) colleges within the Washington Community and Technical Colleges (CTC) system, based on size of institution, program offerings, and student demographics (see Table Y). The Washington State Board for Community and Technical Colleges (SBCTC) compiles dashboards to allow comparison with our benchmark colleges, including enrollment, student progression, and post-completion outcomes. Comparison of Clark College student achievement data with benchmark colleges is available in the Appendix. Table Y. Enrollment and Demographics for Clark College and Benchmark Colleges. Academic Year 2021-2022. Edmonds College 5,157 12,589 30% 51% 35% 31% 9% 34% 24% 17% Green River College 6,572 12,957 23% 46% 50% 10% 13% 45% 29% 10% Highline College 5,994 12,983 36% 61% 36% 39% 10% 36% 20% 39% Bellevue College* 9,909 19,765 19% 56% 46% 10% 15% 57% 26% 6% South Seattle College 3,776 8,892 29% 32% 35% 40% 5% 25% 53% 12% Clark College FTES Headcount % Student of Color % Female % Full Time % Need Based Aid % Running Start % Transfer Intent % CTE Intent % Adult Basic Ed 5,659 11,511 24% 55% 49% 36% 17% 54% 26% 11% DATA SOURCE: State Board for Community and Technical Colleges (SBCTC) Enrollment Data Dashboard. *Bellevue College is included for history as its program mix and size used to be comparable to Clark.
Clark College Cruse Stabilize & Increase Enrollment by 5% ACADEMIC YEAR BY QUARTER 2020-2021 Actual FTE Target FTE Unduplicated Headcount 9,000 8,002 8,000 7,454 7,025 7,000 6,000 5,000 4,590 4,354 4,029 3,797 4,000 3,512 3,436 3,296 3,000 1,786 1,786 2,000 1,000 0 Summer 83% Fall 81% Winter 81% Spring 82% DATA SOURCE: State Board for Community and Technical Colleges (SBCTC) Enrollment Data Dashboard. Does not include BAS or R/S
Clark College Cruse Stabilize & Increase Enrollment by 5% ACADEMIC YEAR BY QUARTER 2021-2022 Actual FTE Target FTE Unduplicated Headcount 8,000 7,392 6,814 6,764 7,000 6,000 5,000 3,759 4,000 3,639 3,630 3,261 3,230 3,214 2,871 3,000 1,742 2,000 1,465 1,000 0 Summer 84% Fall 97% Winter 89% Spring 99% DATA SOURCE: State Board for Community and Technical Colleges (SBCTC) Enrollment Data Dashboard. Does not include BAS or R/S
Clark College Cruse Stabilize & Increase Enrollment by 5% Race* New Applicants Fall 2021 398 Yield Rate Returning Applicants Fall 2021 65 Yield Rate Asian 53% 52% Black 261 36% 56 25% Latinx 759 42% 134 34% Native American Pacific Islander 120 43% 53 43% 121 44% 21 29% White 3,248 52% 751 46% DATA SOURCE Fall 2021 enrollment, Clark College Local, *Students are counted once in every category they identified with.
Clark College Cruse Stabilize & Increase Enrollment by 5% Age New Applicants Fall 2021 Yield Rate Returning Applicants Fall 2021 Yield Rate Under 19, No High School Diploma 1,270 75% 6 100% Under 19, with High School Diploma 1,100 51% 29 52% 19 to 24 951 34% 332 52% 25 to 44 769 27% 458 39% 45+ 183 28% 92 32% DATA SOURCE Fall 2021 enrollment, Clark College Local
Clark College Wickline Increase Retention by 10% By 2024, increase fall-to-fall retention of all students by 10%.
Clark College Wickline Increase Retention by 10% - Highlights Strategies/Outcomes Through equity focused, college-wide reengagement, revitalize guided pathways work by enhancing the student experience - improve access, student retention & completion for ALL students Development- data dashboards to guide programming & assessment Increased# of fully online degree pathways available to students Implementation of Phase 1 "all-user" adoption of an Early Alert System Implementation of Auto Enrollment for existing cohort (selective admission and automotive pathways) programs Identified pathways & embedded COLL101 or outcomes are embedded in all degree programs except the following: ACED, AAS, & ECE Continual development of Open Educational Resource (OER) in AY22/23.
Clark College Wickline Increase Retention by 10% - Highlights Persistence Momentum (1.1): Fall Persistence Momentum (1.1): Fall- -to to- -Fall Retention Rates Rates DEFINITION: Fall-to-fall retention rate for First- Time Students. Fall Retention Table Z. Fall 2018- Fall 2019 Fall 2019- Fall 2020 Fall 2020- Fall 2021 Clark College 51% 46% 51% 47% 50% 33% 47% 42% 46% 45% 51% 27% 51% 42% 53% 43% 53% 36% Student Achievement THRESHOLD: 60% Edmonds College Green River College Highline College Bellevue College South Seattle College Table Z . Clark College Fall-to-Fall Retention Rates with Comparison Colleges. COHORT: First- Time Students, Excluding Running Start Dual- Enrollment. DATA SOURCE: State Board for Community and Technical Colleges (SBCTC). First-Time Entering Student Outcomes dashboard.
Clark College Wickline Increase Retention by 10% - Highlights Student experience as shared from Area of Study Coach: New student moved to the United States during the summer of 2020. She moved from her home in India to be with her husband (a Clark alumni) in Vancouver, Wa. In coaching session, she expressed interest in finding community at Clark. Met Csendi in International office who showed her the the living area for students and informed her about events and activities that they would be hosting through out the summer. After meeting Csendi we walked to ASCC and the student employee at the front desk shared out activities and events that ASCC would be hosting. Visited the library, employees shared information about how to use and access the library. After visiting various offices, the student took a moment to stop and tell me that today has been the best day, since I moved from India . The student shared that she felt seen and heard. She appreciated so much that someone was able to understand her culture and gender norms and expectations.
Clark College Willard Reduce Equity Gaps by 50% By 2024, reduce the equity gap by 50% for non-dominant historically underrepresented students in retention, progression, and completion.
Clark College Willard Reduce Equity Gaps by 50% - Highlights Strategies/Outcomes Implementation of culturally responsive orientation, peer mentoring, & re-entry course @ Larch, development of AoS Success Coaches Enhanced academic student supports to reduce equity gaps in course success by implementation of MESA mentors & AoS Success Coaches Interventions @ scale to accelerate rates of English completionwithin the first year. Scaled up Quality Matters for Online Courses Development of co-reqs for Math 107 & Math 146; established math pathways in are service district high schools to accelerate rates of math completionwithin the first year Embedded program-relevant power, privilege, and inequity course work into nearly all degree programs except Health Information Management AAT, Medical Assistant AAT, Pharmacy Technician Leadership AAT Leveraged efforts of TLC, ODEI, & SBCTC to provide equity focused professional development training for faculty & staff Continued infusion of culturally responsive curriculum throughout Clark programs
Clark College Willard Reduce Equity Gaps by 50% - Highlights Table 1. High-Level Scorecard for Student Achievement Outcomes and Indicators For each, cohort includes First-Time Students, Excluding Running Start Students. Table 1. Student Achievement Thresholds 40% 60% 65% 40% Equity Gaps between Students of Color and White Students Current Status Increase Completion Fall-to-Fall Retention Earned 15 Credits First Year College-Level Math in First Year (First- Time Ever in College Only) 20% 51% 62% 25% 15% Even rates, HU-SOC 47% 56% 21% College-Level English in First Year (First-Time Ever in College Only) Employed and/or Transferred to 4 Year Institution (Follow Up After 4 Years) Transfer Intent: Transfer Rate to 4-Year Institution CTE intent: Employment Rate 65% 55% 50% 21% 32% 27% 75% 53% +54% DATA SOURCE: State Board for Community and Technical Colleges (SBCTC). First-Time Entering Student Outcomes dashboard.
Clark College Willard Reduce Equity Gaps by 50% - Highlights Table 2. Student Achievement Indicators with Comparison Colleges. COHORT: All First-Time Students, Excluding Running Start Dual-Enrollment Green River College South Seattle College Edmonds College Highline College Bellevue College Clark College Table 2. Completion Fall-to-Fall Retention Earned 15 Credits First Year College-Level Math in First Year College-Level English in First Year Employed and/or Transferred to 4 Year Institution (after 4th year) Transfer Intent: Transfer Rate to 4- Year Institution 31% 42% 56% 23% 44% 28% 53% 61% 26% 57% 21% 43% 58% 28% 60% 20% 53% 64% 33% 49% 18% 36% 57% 27% 42% 20% 51% 62% 25% 55% 25% 24% 25% 38% 39% 27% CTE intent: Employment Rate 69% 70% 69% 69% 61% 53% DATA SOURCE: State Board for Community and Technical Colleges (SBCTC). First-Time Entering Student Outcomes dashboard.
Clark College Willard Reduce Equity Gaps by 50% - Highlights Student self-referred from visiting ODEI often, as they were struggling with some problems at home and an uncomfortable situation with an instructor. An employee was able to provide them emotional support regarding their personal issues and make referrals to Counseling Services on campus to provide further assistance. The situation with the instructor involved an assignment that activated the student s history of eating disorders and mental health issues, and the employee advocated for the student to the instructor on the grounds of the student s safety and on the equity of the assignment as a whole. The instructor was eventually receptive and is even considering changing the assignment and module for the health course in the future.
Clark College Cruse Increase Student Success by 5% By 2024, increase student success outcomes by 5%. 5%
Clark College Cruse Increase Student Success by 5% Strategies/Outcomes Expanded partnerships with industry, community organizations, & K-12. Continue to assess the effectiveness of existing K-12 CTE articulations. Assessing & Resolving barriers in courses, processes, & placement. Development of One Stop in Gaiser 10,289 student visits, evaluation of placement effectiveness, implementation of math cross walks for area high schools by faculty Utilized the program viability process to ensure programs are tied to industry & community needs. Recommendations & approved program improvement action plans for Business, BAS in Applied Management, EMT, Pre-Nursing, Nursing, & Phlebotomy during AY22/23.
Clark College Cruse Increase Student Success by 5% Mission Fulfillment Outcome: Increase Completion Rates One of Clark College s mission fulfillment outcomes is to increase the rate at which degree-seeking students complete their degrees and/or certificates. Using the 150% time to completion, Clark College analyzes a three-year completion rate. Clark College as well as benchmark colleges offers dual-enrollment programs (i.e., Running Start). Given the differences in student populations for dual-enrolled students, Clark College reviews its outcomes for All Students (including first-time students and Running Start students) as well as separately for First-Time Students Only. The Clark College completion rate for 2018-19 cohort (20%) is significantly lower than official IPEDS Completion Rate; this is due to the more inclusive cohort definition of our mission fulfillment outcome (all first-time students), which also includes part-time students and students who have attended previous institutions. Comparison of Clark College completion rates to comparison colleges is provided in Table 3. Table X. Completion Rate within 150% Timeframe for All Students, including First-Time Students and Running Start Students. Table 3. All Students First-Time Students Only (First-Time and RS Students) 2016-17 Cohort Cohort 25% 26% 33% 29% 22% 16% 2017-18 2018-19 Cohort 2016-17 Cohort 2017-18 Cohort 2018-19 Cohort Clark College Edmonds College Green River College Highline College Bellevue College South Seattle College 23% 25% 32% 26% 23% 17% 24% 23% 31% 24% 20% 20% 20% 32% 31% 28% 22% 14% 18% 30% 29% 24% 24% 16% 20% 31% 28% 21% 20% 18% DATA SOURCE: State Board for Community and Technical Colleges (SBCTC). First-Time Entering Student Outcomes dashboard
Clark College Cruse Increase Student Success by 5% Student has been at Clark since Fall 2019 and enrolled in 2-3 classes each term, but, until last term, she had difficulty keeping up with schoolwork. She ended up being placed on Academic Probation due to low GPA of 1.5. She completed 27 courses out of which she received 13 F s. When we met, she was overwhelmed by having to balance 30+ hours of work and being a full-time student. We agreed to meet for an hour once a week during the spring term to help her learn how to manage time and develop effective study skills. In our weekly meetings, we discussed challenges the student was experiencing and specific solutions to overcome those challenges using positive self-talk, using Google Calendar/To Do list to manage tasks, checking grades/missed work regularly, communicating with professor, studying with classmates, etc. After 13 meetings, the student is finishing up the term with possibly All A s if not an A and a B. She has also become excited about learning, more confident, and less stressed about workload.
Clark College Cruse Increase Student Success by 5% Table 4. Clark College Completion Rates within 150% Timeframe for 2018-2019 Cohort by Student Populations. COHORT: First-Time Students, Excluding Running Start Dual- Enrollment. Disaggregation of Completion Rates by Student Populations Running Start Students 33% 33% All First-Time Students Under Social Equity, the mission fulfillment outcome is to Eliminate racial disparities in educational outcomes. At Clark College, all student achievement indicators are disaggregated by student demographics to understand disparities in educational attainment for systemically non-dominant populations. This includes disaggregation by age, gender, race/ethnicity, and receipt of need-based aid. Table 4. Overall Under Age 25 Age 25 or Older Female Male Student of Color Not Student of Color (White, non- Latinx) Not Reported Receiving Need-Based Aid Not Receiving Need-Based Aid Students 24% 25% 21% 26% 21% 21% 20% 19% 21% 22% 18% 16% N/A 36% 28% 36% 25% 27% 19% 26% 21% 25% 19% 21% 32% 31% N/A 33% DATA SOURCE: State Board for Community and Technical Colleges (SBCTC). First-Time Entering Student Outcomes dashboard.
Clark College Cruse Increase Student Success by 5% Table 5. Clark College Completion Rates within 150% Timeframe for 2018-2019 Cohort by Student Race/Ethnicity. COHORT: First-Time Students, Excluding Running Start Dual-Enrollment. Disaggregation of Completion Rates by Student Populations Running Start Students Insuff. 44% 26% 38% All First-Time Students Under Social Equity, the mission fulfillment outcome is to Eliminate racial disparities in educational outcomes. At Clark College, all student achievement indicators are disaggregated by student demographics to understand disparities in educational attainment for systemically non-dominant populations. Table 5. American Indian or Alaska Native Asian Black or African-American Latinx Students 11% 30% 15% 16% 8% 23% 13% 11% Native Hawaiian or Other Pacific Islander White Multiracial 19% 25% 23% 14% 21% 19% Insuff. 32% 33% Historically Underrepresented Student of Color (AIAN, Black/AA, Latinx, NH/PI) 19% 15% 33% DATA SOURCE: State Board for Community and Technical Colleges (SBCTC). First-Time Entering Student Outcomes dashboard.
Clark College Wickline Increase Enrollment @ CTC & CCW by 5% By 2024, increase enrollment at CTC & CCW by 5% through Intentional Pathways and Holistic Support Services. 5%
Clark College Wickline Increase Enrollment @ CTC & CCW by 5% Strategies/Outcomes Created CCW as Home to Allied Health Pathways.Health Science pathways (Medical Assisting, Pharmacy Tech, Phlebotomy, Nursing) @ CCW were offered Fall, Winter, and Spring 2021/2022 Developed & expanded partnerships with industry and labor partners around CCW ( Legacy, PeaceHealth, SIEU, etc.). Includes pathways for incumbent workers; internships/externships; placement upon completion. Guided Pathways supported development of video series associated with crisis scene simulations Generated student & community interest in the new campus by promoting RS classes & programs to be offered @ Boschma Farms. Congressionally Directed Funding allocated for equipment acquisition for the Center for Advanced Manufacturing and Renewable Energy ($1.5M) Identified High-Demand BAS Programs to be located @ CTC/CCW by conducting feasibility reviews of BAS programs
Clark College Wickline Increase Enrollment @ CTC & CCW by 5% CCW CTC Enrollments, Annualized FTES and Distinct Departments of Classes Offered by Academic Quarter Distinct Depts Distinct Depts Enrollments Annualized FTES Enrollments Annualized FTES 61.7 226.2 Academic Year 2019-2020 Summer 2019 21 0.5 1 513 27.72 13 Fall 2019 520 26 6 1433 103.9 26 Academic Year 2019- 2020, 2020-2021, and 2021-2022 Winter 2020 680 35.2 7 1135 94.6 21 Spring 2020 (Covid) 20.3 21.7 Academic Year 2020-2021 Summer 2020 105 7.5 1 DATA SOURCE: SBCTC Data Warehouse Files, CLASS and STUCLASS. BLDG field used to identify CTC and CCW locations. For quarters without BLDG data, pulled locally from StudentFTE and ClassMeetin gPattern to determine location via FacilityID. Fall 2020 183 6.1 1 17 1.5 1 Winter 2021 168 5.8 1 89 7.1 1 Spring 2021 216 8.4 2 56 5.6 1 68.9 21.4 Academic Year 2021-2022 Summer 2021 25 2.2 1 Fall 2021 327 16.3 6 20 2.1 1 Winter 2022 570 25.9 6 48 3.4 2 Spring 2022 499 26.6 6 134 13.6 5 Indicates data pulled locally due to missing SBCTC Data Warehouse field for Fall 2021 and Winter 2022
Clark College Cruse Next Steps/Questions Based on data recalibrating CWSEM & GP strategies Roll out of the Strategic Plan Assessment & Rebuilding Data Infrastructure Professional Development NCORE, PPI, NWREC, DEI Speakers Adult Re-engagement Outreach focused on Systemically Excluded Students Increase Quality Matters Certification Caring Campus Retention Plan GP focus Career Pathways & Advising Interventions & Classroom Environment Climate Survey (students, staff, and faculty) - inform next steps
