Atlanta Public Schools Budget Commission Meeting Details
This document provides detailed information about the Atlanta Public Schools Budget Commission meeting held on February 18, 2016. It includes the agenda, meeting goals, calendar and timeline of the Fiscal Year 2017 General Fund Budget Development, and outlines the budget planning process from initial goals to final approvals.
Download Presentation

Please find below an Image/Link to download the presentation.
The content on the website is provided AS IS for your information and personal use only. It may not be sold, licensed, or shared on other websites without obtaining consent from the author.If you encounter any issues during the download, it is possible that the publisher has removed the file from their server.
You are allowed to download the files provided on this website for personal or commercial use, subject to the condition that they are used lawfully. All files are the property of their respective owners.
The content on the website is provided AS IS for your information and personal use only. It may not be sold, licensed, or shared on other websites without obtaining consent from the author.
E N D
Presentation Transcript
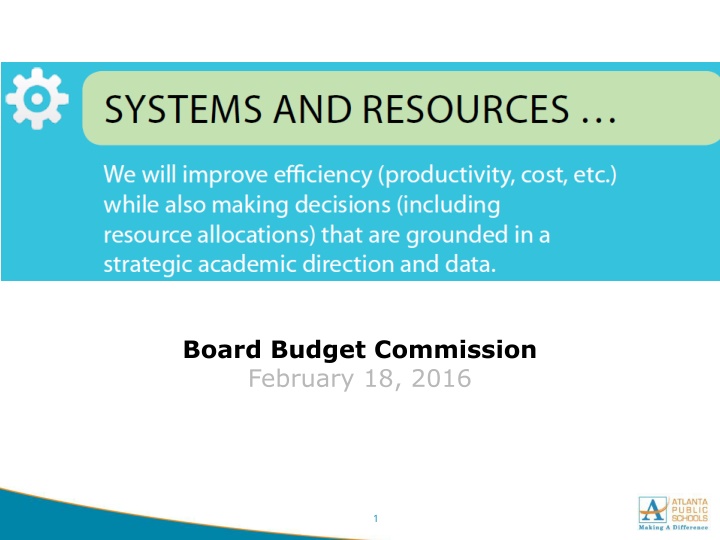
Board Budget Commission February 18, 2016 1
Agenda Meeting Goals -5 Minutes Calendar and Timeline -5 Minutes FY2017 General Fund Revenue - 15 Minutes FY2017 General Fund Expenditures - 20 Minutes Questions and Wrap-Up - 15 Minutes 2
Goals For this meeting -TBD Going forward -TBD 4
Budget Calendar (1 of 3) Atlanta Public Schools Fiscal Year 2017 General Fund Budget Development Calendar 9/4/2015 Item # v10 Item Description Board/Superintendent workshop - Initial Academic and Operating Goals and Priorities for Budget Parameters Senior Executive Leadership Team review of the Fiscal Year 2017 budget planning framework and timeline Budget parameters identified and finalized by Senior Executive Leadership Team Dates 1 August 27, 2015 2 September 1, 2015 3 September 1, 2015 4 Fiscal Year 2017 Budget Planning Parameters and Timeline presented and approved by the Board September 8, 2015 5 6 Expanded Cabinet discusses budget framework, parameters and timeline Senior executive leadership team discussion of the budget September 17, 2015 October 27, 2015 7 Board reviews/discusses Fiscal Year 2017 budget assumptions, staffing formulas and strategic priorities November 2, 2015 8 9 Departments receive Fiscal Year 2017 Budget templates Board Budget Commission Meeting to Discuss Multi-year Budgeting Strategy Budget and Finance Advisory Committee, initial meeting (CFO only) Expanded Cabinet discusses budget approach, options and provides feedback November 11, 2015 November 12, 2015 November 12, 2015 November 19, 2015 10 11 12 Board approves Fiscal Year 2017 budget assumptions, staffing formulas and strategic priorities December 14, 2015 13 14 15 16 17 18 19 Budget and Finance Advisory Committee, second meeting Fiscal Year 2015 Mid-Year adjustment Departments submit completed budgets Governor's State of the State Address and Education Budget (OMB) Board Budget Commission Meeting to Discuss Multi-year Budgeting Strategy Budget and Finance Advisory Committee, third meeting Budget Office compiles budget December 17, 2015 January 11, 2016 January 14, 2016 January 14, 2016 January 21, 2016 January 21, 2016 January 29, 2016 6
Budget Calendar (2 of 3) Atlanta Public Schools Fiscal Year 2017 General Fund Budget Development Calendar 9/4/2015 v10 Item # Item Description FC Tax Commissioner and FC Chief Assessor Presentation at Board or Budget Commission Meeting Senior Executive Leadership Team budget retreat to complete preliminary budget proposal 22 Budget and Finance Advisory Committee, fourth meeting Superintendent presents the Fiscal Year 2017 Budget Primer to the Board Budget Commission meeting (at call of Committee chair) 24 Board Budget Commission meeting (at call of Committee chair) 25 Superintendent presents the Fiscal Year 2017 Budget Primer to the Board 26 Conduct regional public meeting for Fiscal Year 2017 General Fund Budget 27 Conduct regional public meeting for Fiscal Year 2017 General Fund Budget 28 Board Budget Commission meeting (at call of Committee chair) 29 Conduct regional public meeting for Fiscal Year 2017 General Fund Budget 30 Board Budget Commission meeting (at call of Committee chair) 31 Budget and Finance Advisory Committee, fifth meeting 32 Conduct regional public meeting for Fiscal Year 2017 General Fund Budget Dates 20 February 1 29, 2016 21 February 2, 2016 February 11, 2016 23 February 18, 2016 February 29, 2016 March 7, 2016 March 10, 2016 March 17, 2016 March 17, 2016 March 24, 2016 March 28, 2016 March 28, 2016 March 31, 2016 33 Conduct Public Hearing on FY17 Budget April 11, 2016 34 Superintendent presents the Fiscal Year 2017 Budget to the Board (Tentative adoption) April 11, 2016 35 36 37 38 First read of the tax Millage rates for Fiscal Year 2017 Salary Hearing #1 (If necessary) Tax assessor provides preliminary appraisal values to District Salary Hearing #2 (If necessary) April 11, 2016 May 5, 2016 May 6, 2016 May 12, 2016 7
Budget Calendar (3 of 3) Atlanta Public Schools Fiscal Year 2017 General Fund Budget Development Calendar 9/4/2015 v10 Dates Item # Item Description 39 Superintendent presents the Fiscal Year 2017 Budget to the Board (Final Adoption) June 6, 2016 Final adoption of the tax Millage rates for Fiscal Year 2017 (may require a called Board meeting (public hearings) depending on the county's schedule and millage rollback) 40 June-16 41 Advertise the tax digest for the five year history Fiscal Years 2011-2016 June-16 42 Advertise and publish notice of tax rate and budget June-16 43 Advertise the first and second public hearings for the tax Millage rates (If necessary) June-16 44 Hold the first and second public hearing on the tax Millage rate (If necessary) June-16 45 Advertise the third public hearings for the tax Millage rates (If necessary) June-16 46 Hold the third public hearings for the tax Millage rates (If necessary) June-16 47 Deadline for millage rates to be delivered to Fulton County Tax Commissioner June-16 48 Tax assessor provides final appraisal values to the District August 1, 2016 8
Considerations for Discussion Roughly 26 percent of general fund revenue comes from the State. State Starting in FY17, APS will receive $4.5 million more annually as a result of becoming a charter system. $250 $200 $210.39 $206.26 $202.22 $198.25 $194.36 $181.86 $167.22 $150 In millions Assumption of $8.0 million increase in QBE for FY2017. $100 $50 General Assembly is considering significant changes to its funding formula which makes FY18-FY21 difficult to forecast (2% growth assumed in these years). $0 FY2015 Actual FY2016 Amended Budget FY2017 Projected FY2018 Projected FY2019 Projected FY2020 Projected FY2021 Projected 10
Considerations for Discussion A mil of tax is equal to $1.00 per every $1,000 of assessed valuation of real estate property. APS Millage Rate Trend 23 22.64 22.64 22.5 22 21.64 21.64 21.64 21.64 21.64 21.64 21.64 21.64 21.5 Since FY2009, the APS millage rate has stood at 21.64 21 20.42 20.42 20.5 20 19.5 One mil currently generates about $22 million. 19 FY2005 FY2006 FY2007 FY2008 FY2009 FY2010 FY2011 FY2012 FY2013 FY2014 FY2015 FY2016 11
Considerations for Discussion Roughly 70 percent of general fund revenue comes from local property taxes. Local $600 $588.67 $571.53 $554.88 $538.72 We anticipate steady growth of the tax digest will continue over the next several years. $500 $523.03 $498.12 $454.93 $400 In millions $300 The projections assume a 5% increase* for FY2017 and a continued annual 3% growth rate in out years. $200 $100 $- FY2015 Actual FY2016 Amended Budget FY2017 Projected FY2018 Projected FY2019 Projected FY2020 Projected FY2021 Projected *Revised projected local revenue assumptions; 3% growth presented to Board on December 14th. 12
Considerations for Discussion Includes Payments in Lieu of Taxes, tuition, investment interest, rental of facilities, sale of assets, lost and damaged reimbursements, charter buy-back, field trips, and other sources. Other $25 $23.57 $20 $18.59 $15 In millions $13.07 $13.07 $13.07 $12.57 $12.57 $10 $5 FY2016 assumes back-payment of IGA $0 FY2015 Actual FY2016 Amended Budget FY2017 Projected FY2018 Projected FY2019 Projected FY2020 Projected FY2021 Projected 13
Considerations for Discussion APS is projected to see steady revenue growth in FY2017 through FY2021. Revenue Total $900 $800 $812.13 $790.86 $770.17 $700 $749.54 $729.96 $703.55 $600 $640.74 In millions $500 $400 $300 $200 $100 $0 FY2015 Actual FY2016 Amended Budget FY2017 Projected FY2018 Projected FY2019 Projected FY2020 Projected FY2021 Projected 14
Considerations for Discussion As the local tax digest grows and as existing charter schools complete their grade-level build out, expenditures related to charter school scaling will continue to grow. Charters also receive a portion of local revenue which is not reflected here. Charter School Scaling $120.00 $100.00 $103.10 $99.99 $95.62 $80.00 $88.01 $73.57 $60.00 $40.00 $20.00 $0.00 FY2015 Actual FY2016 Amended Budget FY2017 Projected FY2018 Projected FY2019 Projected Fiscal Year 2016 2017 2018 2019 Forecasted Enrollment 8,063 8,462 8,849 9,124 16
Considerations for Discussion The annual pension liability payment represent 7.2% of general fund spending. The current annual payments are roughly $1,000 per student, and will grow to $1,400 per student by 2029. Unfunded Pension $70 $60 $58.30 $56.60 $55.00 $50 $53.40 $51.90 $50.40 $48.90 $40 $30 $20 $10 $- FY2015 Actual FY2016 Amended Budget FY2017 Projected FY2018 Projected FY2019 Projected FY2020 Projected FY2021 Projected 17
Considerations for Discussion APS has a long- standing practice of maintaining a fund balance above 7.5% of revenue, but below the statutorily required cap of 15%. Fund Balance History $180 $160 $157.90 $151.76 $140 $120 $109.70 $100 $89.50 $80 With a projected FY17 Budget around $730m, that would mean a fund balance between $54.75m and $109.49m $83.60 $81.30 $75.37 $75.37 $60 Minimum FY2016 $40 $20 $0 FY2009 FY2010 FY2011 FY2012 FY2013 FY2014 FY2015 FY2016 18
Multi-Year Planning Framework Revenue FY2015 Actuals FY2016 Budget FY2017 Proposed FY2018 Projected FY2019 Projected FY2020 Projected FY2021 Projected State Local Other Total $ 167,216,672 $ 454,927,297 $ 18,591,110 $ 640,735,079 9% $ 181,863,915 9% $ 498,122,471 27% $ 23,568,069 10% $ 703,554,455 7% $ 194,363,915 5% $ 523,028,595 -47% $ 12,568,069 4% $ 729,960,579 2% $ 198,251,193 3% $ 538,719,452 0% $ 12,568,069 3% $ 749,538,715 2% $ 202,216,217 3% $ 554,881,036 4% $ 13,068,069 3% $ 770,165,323 2% $ 206,260,542 3% $ 571,527,467 0% $ 13,068,069 3% $ 790,856,078 2% $ 210,385,752 3% $ 588,673,291 0% $ 13,068,069 3% $ 812,127,113 Expenditures FY2015 Actuals FY2016 Budget FY2017 Proposed FY2018 Projected FY2019 Projected FY2020 Projected FY2021 Projected Instruction Pupil Services Improvement Of Instructional Services Educational Media Services Federal Grant Administration General Administration School Administration Support Services - Business Maintenance And Operation Of Plant Services Student Transportation Service Support Services - Central Other Support Services School Nutrition Program Other Outlays Debt Service Total $ 416,378,801 $ 28,028,356 $ 13,455,776 $ 11,101,882 8% $ 451,061,016 23% $ 34,485,462 0% $ 13,424,978 13% $ 12,554,915 0% $ 2,702 6% $ 10,583,110 -1% $ 42,442,794 41% $ 13,850,776 0% $ 71,412,012 2% $ 27,437,086 2% $ 21,453,596 65% $ 782,419 19% $ 355,640 19% $ 1,326,877 -28% $ 2,381,074 7% $ 703,554,455 -100% 0% 0% 0% 0% -100% 0% 0% 0% 0% -100% 0% 0% 0% 0% -100% 0% 0% 0% 0% -100% 0% 0% 0% 0% $ 10,028,251 $ 42,923,569 $ 9,812,707 $ 71,589,343 $ 26,943,014 $ 21,026,080 $ 473,342 $ 299,212 $ 1,112,046 $ 3,303,101 $ 656,475,480 -100% 0% 0% 0% 0% -100% 0% 0% 0% 0% -100% 0% 0% 0% 0% -100% 0% 0% 0% 0% -100% 0% 0% 0% 0% -100% 0% 0% 0% 0% -100% 0% 0% 0% 0% -100% 0% 0% 0% 0% -100% 0% 0% 0% 0% -100% 0% 0% 0% 0% -100% $ - 0% $ - 0% $ - 0% $ - 0% $ - Impact to Fund Balance $ (15,740,401) -100% $ 0 -100% Strategic Priorities FY2015 Actuals FY2016 Budget FY2017 Proposed 0% FY2018 Projected 0% FY2019 Projected 0% FY2020 Projected 0% FY2021 Projected 0% 0% Pay Parity and Compensation* CRCT Remediation / Enrichment Turnaround Strategy Signature Programs Charter System Transition Total $ - $ - $ - $ - $ - $ - 0% $ 11,000,000 0% $ 5,000,000 0% $ 5,000,000 0% $ 1,000,000 0% $ 250,000 0% $ 22,250,000 17% $ 12,905,015 -10% $ 4,500,000 400% $ 25,000,000 1092% $ 11,917,547 0% $ 250,000 145% $ 54,572,562 -2% $ 12,591,959 -11% $ 4,000,000 0% $ 25,000,000 16% $ 13,862,934 0% $ 250,000 2% $ 55,704,892 36% $ 17,156,411 -13% $ 3,500,000 0% $ 25,000,000 2% $ 14,104,033 0% $ 250,000 8% $ 60,010,444 29% $ 22,155,281 -14% $ 3,000,000 0% $ 25,000,000 -2% $ 13,805,552 0% $ 250,000 7% $ 64,210,833 25% $ 27,747,224 -17% $ 2,500,000 0% $ 25,000,000 5% $ 14,528,667 0% $ 250,000 9% $ 70,025,891 Other Cost Considerations FY2015 Actuals FY2016 Budget FY2017 Proposed FY2018 Projected FY2019 Projected FY2020 Projected FY2021 Projected Health Benefits TRS Pension Special Ed. MOE Charter School Scaling Total *Assumes annual step increase and incremental 1% COLA each year. $ 55,912,321 $ 38,974,031 $ 48,900,000 $ 43,182,945 $ 73,570,000 $ 260,539,298 -19% $ 45,026,832 16% $ 45,330,305 3% $ 50,400,000 6% $ 45,982,940 20% $ 88,010,000 5% $ 274,750,077 6% $ 47,526,832 3% $ 46,613,238 3% $ 51,900,000 3% $ 47,389,122 9% $ 95,620,000 5% $ 289,049,191 3% $ 48,952,637 3% $ 48,011,635 3% $ 53,400,000 3% $ 48,810,796 5% $ 99,990,000 3% $ 299,165,067 3% $ 50,421,216 3% $ 49,451,984 3% $ 55,000,000 3% $ 50,275,120 3% $ 103,100,000 3% $ 308,248,319 3% $ 51,933,852 3% $ 50,935,543 3% $ 56,600,000 3% $ 51,783,373 2% $ 105,162,000 3% $ 316,414,769 3% $ 53,491,868 3% $ 52,463,610 3% $ 58,300,000 3% $ 53,336,874 2% $ 107,265,240 3% $ 324,857,592 19
Looking Ahead to FY17 $242 m +TBD TBD $47 $96 $52 $47 TBD FY2017 $703.5 m $22 $46 $88 $50 $45 $452 FY2016 Includes Turnaround, CRCT Remediation/ Enrichment, Flexibility & Signature Programing, Charter System Transition, and Pay Parity $656.5 m $43 $74 $49 $39 $452 FY2015 $- $100 $200 $300 $400 $500 $600 $700 Millions Strategic Priorities Special Ed. MOE Charter Schools Pension liability TRS Contributions Other District Schools, Programs, and Operations 20
Budget Parameters Resource Parameters Estimate Comment The district will establish a millage rate consistent with the Board s mission and vision 1 mil = $22 million District s millage rate has remained at 21.64 since FY2008. The district will maintain a fund balance between 7.5% and the statutory limit of 15% of projected expenditures Estimated fund balance on 6/30/16: $75.3 million With projected FY17 revenues of roughly $730 million, the fund balance should remain above $54.75 million and must remain below $109.49 million. The district will fully realize all funds coming in from intergovernmental agreements $1.5 million Current Estimate 21
Budget Parameters Expenditure Parameter Cost Estimate Comment Allocation decisions will be made to prioritize achieving a more equitable distribution of resources pursuant the district s equity audit. TBD The district will allocate resources to implement effectively the system s move to a charter system operating model. $250,000 The district will fund pension obligations in accordance with State statute and actuarial standards. $51.9 million The district will invest in a multi-year school turn-around strategy that provides additional support and interventions for schools at risk of state take-over. $25.0 million The district will make investments in early childhood education based on findings from research study. The Governors FY2017 budget proposal includes the implementation of a new compensation model to retain teachers TBD 22
Budget Parameters Expenditure Parameter Cost Estimate Comment The district will ensure that the budget is aligned to the Board s mission and vision and that resources are allocated against key district strategic priorities in the areas of: Academic Program * Ongoing implementation of district s CRCT remediation & enrichment efforts Year 2 of support plan for impacted students still enrolled at APS. $4.5 million College Readiness: AP tests, IB exams, early college textbooks, expansion of work based learning, college tours, internships, SAT/ACT prep, and others. * Improvement in student achievement in math, science, and literacy, including a comprehensive materials of instruction strategy (inclusive of textbook adoption and online student and teacher resources) TBD Career Readiness: Dual-enrollment, internships, CTAE, work readiness workshops, career monitoring, CTAE program certification. * Ongoing implementation of signature programming across clusters $12 million * Ongoing implementation of positive behavior supports programming TBD 23
Budget Parameters Expenditure Parameter Cost Estimate Comment The district will ensure that the budget is aligned to the Board s mission and vision and that resources are allocated against key district strategic priorities in the areas of: Talent Management * Strategies to recruit, professionally develop, and retain high-quality staff Additional costs are included in the turnaround budget $40,000 Phase 2 includes placing all non- instructional staff on the proper pay scale, as well as a 1% COLA for all staff and a step increase * Continued implementation of multi-year compensation study recommendations to address pay parity $13 million 24
Budget Parameters Expenditure Parameter Cost Estimate Comment The district will ensure that the budget is aligned to the Board s mission and vision and that resources are allocated against key district strategic priorities in the areas of: Systems & Resources * The safety, security, and well-being of students and staff (including the implementation of a new safety/security model) $10.62 million Includes salaries, benefits, and one- time costs for start-up equipment * Preventative maintenance of support infrastructure (including buildings, buses, and technology) TBD 25
Budget Parameters Expenditure Parameter Cost Estimate Comment The district will ensure that the budget is aligned to the Board s mission and vision and that resources are allocated against key district strategic priorities in the areas of: Culture * Continued implementation of cultural transformation strategy, including strengths-based programming $630,000 Strength Finder licenses for new employees, Gallup engagement for all employees and continued implementation of organizational culture initiatives * Implementation of District s external communications strategy $1.54 million Operating budget for Communications department 26
Whats Next Next Meeting- Monday, February 29th 27
