Analysis of Food Security Sector Funding in HRP 2018
This analysis examines the funds requested, projects submitted and accepted, as well as appeals for the Food Security Sector in the Humanitarian Response Plan (HRP) 2018. It includes details on the distribution of funds, beneficiaries targeted, and the approach taken for funding appeals. The data showcases a comprehensive overview of financial allocations and program priorities.
Download Presentation

Please find below an Image/Link to download the presentation.
The content on the website is provided AS IS for your information and personal use only. It may not be sold, licensed, or shared on other websites without obtaining consent from the author. Download presentation by click this link. If you encounter any issues during the download, it is possible that the publisher has removed the file from their server.
E N D
Presentation Transcript
Food Security Sector HRP 2018 1
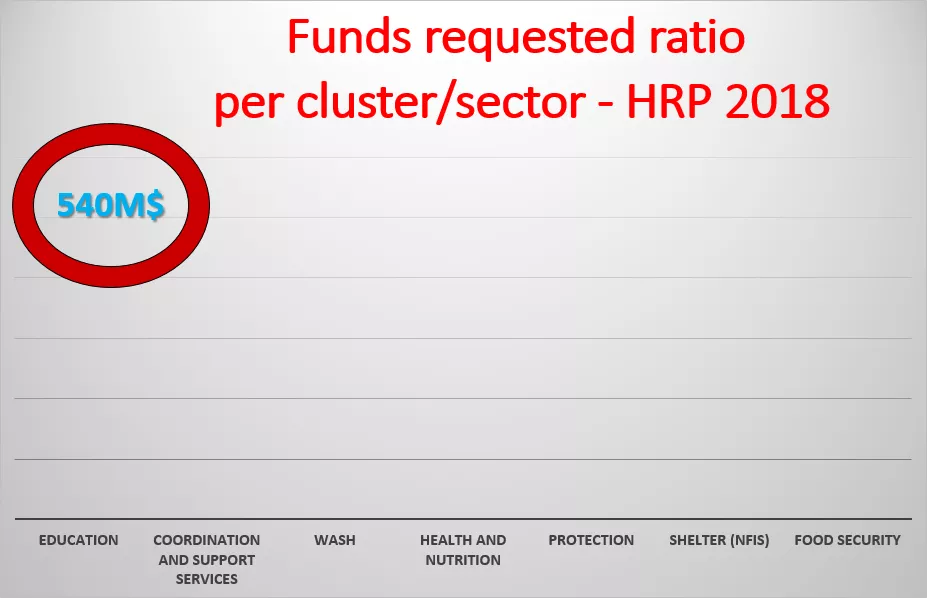
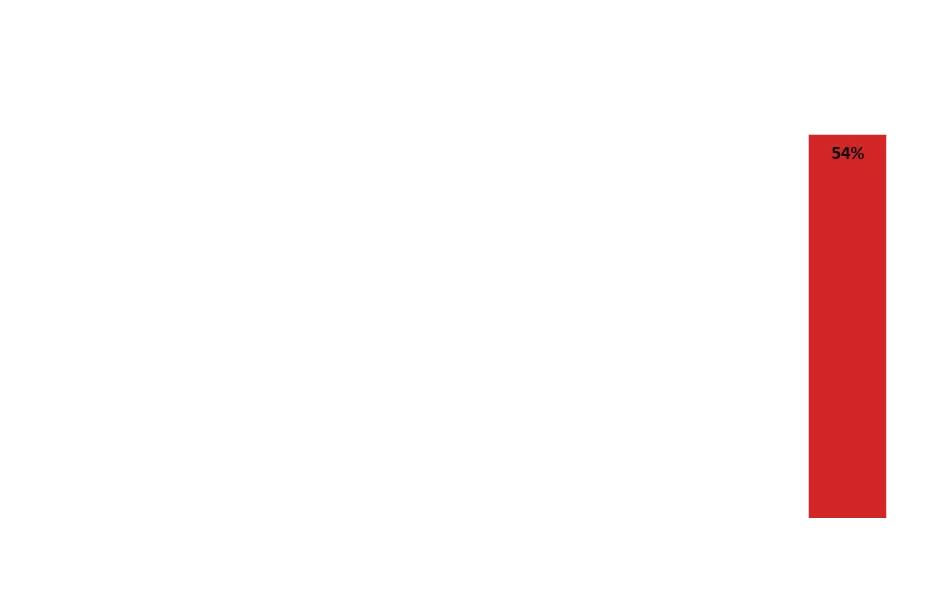
Funds requested ratio Funds requested ratio per per cluster/sector cluster/sector - - HRP HRP 2018 2018 540M$ 54% 17% 8% 7% 4% 5% 5% EDUCATION COORDINATION AND SUPPORT SERVICES WASH HEALTH AND NUTRITION PROTECTION SHELTER (NFIS) FOOD SECURITY 2
HRP HRP 2018 2018 FSS Projects FSS Projects submitted submitted vs vs. accepted . accepted 80 70 71% 85% 60 50 69 40 49 30 20 26 22 10 0 Palestine West Bank Submitted Accepted 3
Funds requested per type of projects-FSS 4
Funds appealed by type of project-WB-HRP 2018 61M$ 24M$ 23M$ 14M$ 23% 40% 37% LIVELIHOOD SUPPORT FOOD ASSISTANCE CASH BASED PROGRAM 5
Funds appealed by type of Funds appealed by type of project HRP 2017 Vs. 2018 HRP 2017 Vs. 2018 project- -WB WB 50.0% 45.0% 40.0% 35.0% 30.0% 25.0% 20.0% 15.0% 10.0% 5.0% 0.0% Livelihood support Food Assistance Cash based program 2017 2018 6
FSS Funds requested and beneficiaries to be targeted HRP 2018 7
Funds requested per WB/GS Funds requested per WB/GS 61,143,650 21% 227,668,679 79% West Bank Gaza 8
Beneficiaries to be targeted per WB/GS Beneficiaries to be targeted per WB/GS 250,000 17% 1,200,000 83% West Bank Gaza 9
Funds requested in West Bank 10
Funds appealed under the multi year program Funds appealed under the multi year program approach approach- -WB WB 32% 68% Yes No 11
Funds requested per WB governorates Funds requested per WB governorates 20 19M$ 18 16 14 12 10 8M$ 7M$ 8 7M$ 6 4M$ 4M$ 4M$ 4 3M$ 3M$ 2M$ 2M$ 2 0 12
Funds requested per WB Funds requested per WB governorates 2017 2017 vs vs 2018 governorates 2018 35.0% 30.0% 25.0% 20.0% 15.0% 10.0% 5.0% 0.0% Bethlehem Hebron Jenin Jericho Jerusalem Nablus Qalqiliya Ramallah Salfit Tubas Tulkarem 2017 2018 13
The average of funds The average of funds appealed per per WB WB areas appealed areas 10% 1% 15% 70% East Jerusalem Hebron-H2 Area A/B Area C 14
Appealed projects per type of organization 15
FSS HRP 2018 FSS HRP 2018 - - A Appealed funds per type of per type of partners ppealed funds partners 85% National International UN Agencies 16
Funds Funds appealed per appealed per type of organization in type of organization in WEST BANK only WEST BANK only 12% 21% 67% National NGO International NGO UN agencies 17
FSS HRP FSS HRP 2018 submitted submitted Vs. 2018 projects projects- -WB Vs. accepted accepted WB 12 11 10 90% 10 72% 9 8 8 6 100% 5 5 4 2 0 Local NGO International NGO UN agencies Submitted Accepted 18
Appealed projects per Appealed projects per type of organization in type of organization in WEST BANK only WEST BANK only Number of partners Number of projects $ appealed % National NGO 8 10 7,480,949 12% International NGO 6 7 12,698,246 21% UN agencies 3 5 40,964,472 67% 19
Appealed projects per type of Partnership 20
FSS HRP FSS HRP 2018 2018- - per type of applicants (without per type of applicants (without partnership) partnership)- -WB WB 60% 49% 50% 40% 30% 23% 20% 10% 0% 0% National NGO International NGO Un agencies 21
FSS HRP FSS HRP 2018 2018- - per type of partnership per type of partnership- -WB WB 40% 36% 35% 30% 25% 20% 15% 14% 10% 9% 5% 5% 5% 0% International & UN UN & UN National & International National & UN National & National 22
