Amusement Park Attraction Simulation Project Overview
This project focuses on optimizing an amusement park attraction through simulation modeling using Simio. Objectives include adjusting system parameters to enhance ride efficiency, improve customer throughput, and maximize utilization of the presentation room. Key performance measures center around maximizing daily customer throughput, presentation room utilization, and ride efficiency. The simulation model undergoes validation and verification, with findings confirming the logic flow and system behaviors in the context of the amusement park setup and ride assumptions.
Download Presentation

Please find below an Image/Link to download the presentation.
The content on the website is provided AS IS for your information and personal use only. It may not be sold, licensed, or shared on other websites without obtaining consent from the author.If you encounter any issues during the download, it is possible that the publisher has removed the file from their server.
You are allowed to download the files provided on this website for personal or commercial use, subject to the condition that they are used lawfully. All files are the property of their respective owners.
The content on the website is provided AS IS for your information and personal use only. It may not be sold, licensed, or shared on other websites without obtaining consent from the author.
E N D
Presentation Transcript
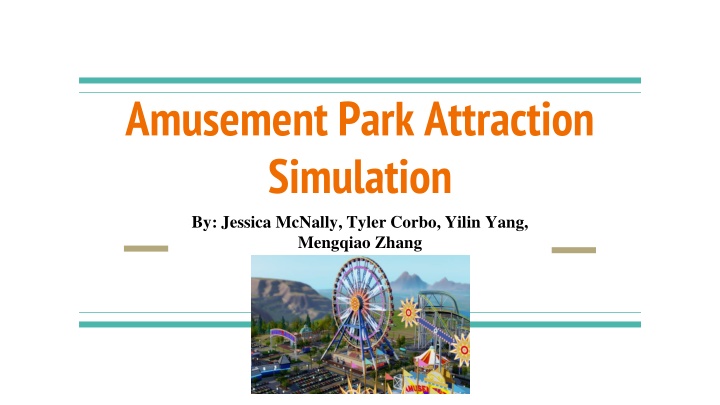
Amusement Park Attraction Simulation By: Jessica McNally, Tyler Corbo, Yilin Yang, Mengqiao Zhang
Project Objectives Determine the appropriate length of the presentation Select two system parameters to be modified to improve the ride Make recommendation to ultimately improve customer throughput and maximize utilization of the ride and presentation room
Methodology What is Simio: It is a unique modeling tool that combines the simplicity of objects with the flexibility of processes to provide modeling capability without programming. Why we use Simio: - Lower cost to deliver results - Better visual experience with integrated 3D technology
Amusement Park System START END 12 rows of 4 Priority Group Riders Nonpriority Group Riders Ride Exit Presentation Room Single Riders
Validation & Verification of Simulation Model Validation Confirmed logic flow diagram with outside experts Verification In the results, the maximum and average number of singles in the system was 15, proving that there were always 15 singles present in the system at once Single and Group entities were given different sizes and colors
Current Ride Assumptions The ride is open for 10 hours every day There are 12 rows of 4 customers for the presentation room and the ride There is always a group available, but not always a single rider when needed There is always a constant number of singles in the system For groups, 75% are priority and 25% are non priority, each containing either 2, 3, or 4 members
Key Performance Measures 3 Main Points of Focus: 1. Maximize Daily Customers (singles and groups) Throughput 2. Maximize Utilization of the Presentation Room 3. Maximize Utilization of the Ride
Optimizing Presentation Time In general, when the presentation is 4 minutes, the system has the best performance
Optimizing Presentation Time Improved Key Performance Measures: Presentation Time (min) Utilization of Presentation Room (%) Utilization of Rides (%) Throughput of Singles 97.55 66.32 1,586 6 (Original) 95.95 97.97 2,234 4 (Modified)
Sensitivity Analysis Factors Number of Rows in the Ride Add two rows to the ride (12 rows to 14 rows) Time of Safety Check Hire one more employee for safety check Reduce safety check time in half (27 seconds to 13.5 seconds) Response Variables Throughput of Customers Utilization of Ride Utilization of Presentation Room
Sensitivity Analysis 1) Low(-) Low(-), Capacity=12 rows, Safety Check Time=27 seconds 2) High(+) Low (-), Capacity=14 rows, Safety Check Time=27 seconds 3) Low(-) High (+), Capacity=12 rows, Safety Check Time=13.5 seconds 4) High(+) High(+), Capacity=14 rows, Safety Check Time=13.5 seconds
Performance Measure: Throughput of Single Customers ANOVA Table and Plot Source P-Value A (# of Rows) 0.013 B (Safety Check Time) 0.812 A*B 0.919 Assume significance level=0.05 Factor A (# of Rows) is significant as P-Value is 0.05 Factor B (Safety Check Time) and interaction effect are not significant since P-Value > 0.05
Performance Measure: Throughput of Group Customers ANOVA Table and Plot Source P-Value A (# of Rows) 0 B (Safety Check Time) 0.196 A*B 0.916 Assume significance level=0.05 Factor A (# of Rows) is significant as P-Value is 0.05 Factor B (Safety Check Time) and interaction effect are not significant since P-Value > 0.05
Performance Measure: Utilization of Ride ANOVA Table and Plot Source P-Value A (# of Rows) 0.034 B (Safety Check Time) 0 A*B 0.612 Assume significance level=0.05 Factor A (# of Rows) and Factor B (Safety Check Time) are significant as P-Value is 0.05 Interaction effect is not significant since P-Value > 0.05
Performance Measure: Utilization of Presentation Room ANOVA Table and Plot Source P-Value A (# of Rows) 0.035 B (Safety Check Time) 0.347 A*B 0.735 Assume significance level=0.05 Factor A (# of Rows) is significant as P-Value is 0.05 Factor B (Safety Check Time) and interaction effect are not significant since P-Value > 0.05
Performance Measure Summary Improved Key Performance Measures: Presentation Time (min) Utilization of Presentation Room (%) Utilization of Rides (%) Throughput of Customers 12 Rows (Original) 95.95 97.97 2,234 14 Rows (Modified) 95.94 97.95 2,529
Final Recommendation 1. Decrease the time of the presentation from 6 to 4 minutes. 2. Increase the number of rows in the ride from 12 to 14. Comparison by the numbers: Parameters Current Ride Modified Ride Customer Throughput 1,586 2,529 Presentation Room Utilization 97.55% 95.94% Ride Utilization 66.32% 97.95%
Cost Analysis Decreasing Presentation time from 6 to 4 minutes Cost savings of 33% per presentation Adding 2 rows to the ride One-time cost of adding extra 2 rows No structural changes needed
Reference Slide 3: https://www.simio.com/about-simio/what-is-simio-simulation-software.php Ryan Walker, Teaching Assistant Dr. Harmonosky, Professor
