Trends in North American Attractions for 2017
Attendance at North American amusement/theme parks saw a notable increase in 2017 compared to the previous year. Disney continued to dominate the top positions, while Universal hinted at new theme park additions. However, museums faced a decline in attendance. The public's leisure travel plans for 2018 indicated varying trends across different attraction types. Water parks experienced mixed attendance rates, with some notable exceptions. Overall, while some attractions thrived, others faced challenges in attracting visitors.
Download Presentation

Please find below an Image/Link to download the presentation.
The content on the website is provided AS IS for your information and personal use only. It may not be sold, licensed, or shared on other websites without obtaining consent from the author.If you encounter any issues during the download, it is possible that the publisher has removed the file from their server.
You are allowed to download the files provided on this website for personal or commercial use, subject to the condition that they are used lawfully. All files are the property of their respective owners.
The content on the website is provided AS IS for your information and personal use only. It may not be sold, licensed, or shared on other websites without obtaining consent from the author.
E N D
Presentation Transcript
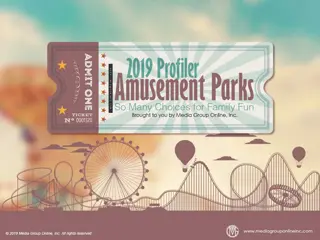
Attendance Improvements for 2017 Following a rather meager 1.2% increase in 2016 attendance at the top 20 North American amusement/theme parks, attendance improved significantly during 2017, with a 2.3% increase, to 151.4 million visitors. Not surprisingly, Florida s 8 amusement/theme parks had the largest share of visitors, or 83.5 million; followed by California s 6 parks, 47.4 million; the Midwest s 3 parks, 10.1 million; the Northeast s 2 parks, 6.5 million; and Ontario, Canada s 1 park, 3.8 million. As in 2016, Disney had the top 5 positions among the 20 largest North American amusement/theme parks for 2017, and a total of 6. Universal had 3 of the top 10.
New Plans and Projects Walt Disney World has experienced a slow start to its 2018 summer season and the reasons may include fewer international visitors, the cost becoming too expensive for middle-class Americans and a lack of new attractions. While Universal has hinted at adding a third theme park in Orlando, Disney expects to open Star War Lands at both Disneyland parks and Disney s Hollywood Studios during 2019 and upgrading Epcot s Future World and Tomorrowland. Many attractions other than theme parks need new plans and projects as museums attendance decreased 5.7% from 2016 to 2017; brewery/winery tours, -2.8%; family entertainment centers, -2.2%; and historic homes & mansions, -1.3%.
The Public Knows What It Wants According to PGAV Destinations 2018 Voice of the Visitor report, 86% of attraction visitors plan to travel for leisure during 2018, but the aggregate increase will be just 1.4%, after a 1.6% increase during 2017. Water parks, +2.4%; aquariums, +2.0%; and science centers, +1.9%, are forecast to experience the largest increases while museums, -3.7%; historic landmarks, -2.1%; art galleries, -1.5%; and theaters, -0.4% will have the largest attendance decreases. Members of Generation Z and the youngest Millennials intend to return to the last attraction they visited more than other age group: during the next 6 months, 33%; during the next 12 months, 36%; and during the next 2 years, 46%.
Water Parks Light on Splashing and Screaming Visitors The decline in 2017 attendance at North American water parks (by percentage) was a bit more than four times the rate of decline during 2016, or -2.9% (15.3 million visitors), compared to -0.7% (15.8 million visitors). Universal s new Volcano Bay was a bright spot during 2017, attracting an estimated 1.5 million visitors, a much larger crowd than the closed Wet N Wild. Cedar Point Shores, Knott s Soak City and Dollywood s Splash Country also generated increased attendance. Nine of the top 10 North American water parks all experienced attendance decreases during 2017 (Volcano Bay was new). Aquatica in Orlando, FL had the worst, at -10%; followed by Disney World s Blizzard Beach, -7.0%, and Typhoon Lagoon, -5.0%.
Most of Top North American Museums Increased Attendance During 2017 Although the PGVA Destinations data on page 1 of the Profiler showed 2017 museum attendance declining 5.7%, Themed Entertainment Association reported a 3.0% increase at the top 20 museums in North America, or a total of 59 million visitors. The National Museum of African American History and Culture and The National Gallery, because of its 2016 renovation and expansion, were largely responsible for the attendance increase. Some museums are adjusting their content and programming to maintain and attract more non-Caucasian American ethnicities while others have re-elevated their admissions fees, so visitors from outside the state pay the total adult charge.
Advertising Strategies Theme parks and other family attractions must highlight potential visitors unmet needs in their advertising: a diverse experience, discounted admissions, a new experience previously unavailable and new attractions. Since adults 65+ are the most heavily exposed to TV, propose to major, regional and local attractions a Grandparents Day, offering reduced admissions and/or a discounted food ticket for adults 65+ accompanied by grandchildren. Suggest local and regional parks cross-promote with community organizations based on Media Group Online s latest Calendar of Events, such as National Food Bank Week during October. Visitors who bring an item for the local food bank receive a discounted admission.
New Media Strategies Conduct regular Website and/or social media polls, asking questions about what visitors liked and didn t like about their visit. This will provide valuable information to make improvements. Then, record and upload videos of those improvements being made. To emphasize the safety and security of your park, ask a local law enforcement officer or security expert to record one or more short videos with tips and ideas for a safer, more secure visit to the park. Influencer marketing can be a major advantage for amusement parks and other family attractions. Two 2018 New Media Insights Reports from Media Group Online provide many of the details for creating and implementing such a program.


