Agribusiness Economics and Decision-Making
Forrest Stegelin
Agricultural & Applied Economics
University of Georgia
In management information systems, a dashboard is
“an
easy to read, often single page, real-time user interface,
showing a graphical presentation of the current status
(snapshot) and historic trends of an organization’s key
performance indicators to enable instantaneous and
informed decisions to be made at a glance.”
An
economic dashboard
is not a predictive or market
timing tool regarding the future performance of any
economic or financial market nor is it intended to predict
or guarantee future investment performance of any sort.
The dashboard is intended as
a tool for agribusiness
owners and managers to set context and perspective
when evaluating the current state of the economy.
Microeconomics
: the area of economics that deals with
individual decision units – people, firms, or markets –
within the economy.
Macroeconomics
: the area of economics that deals with
a nation’s (or industry’s) economy as a whole; the
study of the effects of changes in the production of
goods and services and employment and how they
interact to influence economic performance.
Any firm (on-farm or off-farm) involved in the food
and fiber production and marketing system.
The ever-changing food and agribusiness industries
characterized by firms that:
Move final products
through the food and fiber
system to the ultimate consumer or end-user;
Transform raw agricultural products
into the final
products desired by consumers or end-users;
Produce raw food and fiber products
; or
Supply inputs
to the farm or production sector.
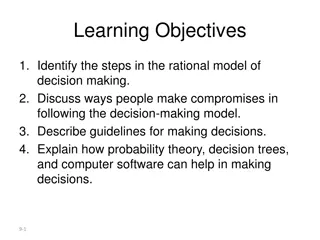
Managerial decision-making and problem-solving.
Prognostications and forecasts and outlook.
Explain and predict economic behavior influencing the
need or demand for an agribusiness’s products or service.
Understand government programs and environmental
policy, interest rates, business cycles and the economy,
general mega trends, and impact of global economics on the
agribusiness firms, organization, industries, and their
clientele/customers.
Economic reports and indicators (leading, lagging, or
roughly coincident and procyclical or countercyclical) to
provide metrics for evaluating the health of the economy
and the agribusiness sector, the latest business cycles, an
dhow the agribusiness’ customers are faring economically.
Business cycles
, including the recession-growth
pendulum swings;
Inflation
, and adjusting price series for inflation;
Interest rates
, comparing real versus nominal and
adjustments to the risk free interest rates;
Unemployment
and the labor market;
Measuring the economy’s
output and income
;
Exchange rates, as they impact
trade
; and
Monetary and fiscal policy
.
Conducting a feasibility study;
Developing a marketing plan;
Preparing a business plan;
Forecasting sales and growth;
Evaluating product or service opportunities;
Completing a sensitivity analysis;
Performing “what-if….?” scenario evaluations;
Anticipating results of implementing alternative
strategies;
Making assumptions and evaluating risks for
goals/objectives.
Perishability
– of inputs, raw products, and finished goods; an
implied “use-by date” to ensure quality.
Food as a product
– vital to the survival and health of every
individual.
Biological nature
of production agriculture (livestock and crops).
Seasonal nature of business
– ebbs and flows in supply and demand.
Uncertainty of the weather
.
Types of firms
– function, size, legal structure, goals/purpose.
Variety of market conditions
– risk characteristics, global/local,
perfect competition, etc.
Rural ties/roots and relationships
in small towns and rural counties.
Government involvement
– policies and regulations, 2014 farm bill,
USDA, EPA, OSHA, HACCP, immigration, taxes, tariffs and quotas
Agricultural and technological vocabularies and performance
measures.
Being able to understand the economy’s health and
direction can help
guide agribusiness decisions
– doesn’t
provide succinct answers to the questions.
Materials are not perfect crystal balls, but are
better than
operating in uncertainty
about the driving forces and
trends affecting agribusiness growth and investments.
Many small- to medium-sized agribusinesses lose focus
on the
industry metrics and general economic
environment
because they have a “micro” or myopic view
of the business.
Does not mean provide a graduate course on
macroeconomics and the
money flow equations
.
Gross National Product (GNP) – Consumption of Fixed Capital
(CFC) =
Net National Product (NNP);
NNP – Indirect Business Taxes (IBT) + Subsidies, less current
surpluses of government enterprises (S) – Business Transfer
Payments (BTP) =
National Income (NI);
NI – Corporate Profits (C)P) – Net Interest (I) – Social Insurance
Contributions (SIC) + Government Transfer Payments (GTP)
+ Personal Interest Paid (PIP) + Personal Dividends Paid
(PDP) + BTP =
Personal Income (PI);
PI – Personal Taxes (PT) =
Disposable Personal Income (DPI);
DPI – Personal Savings (PS) =
Personal Consumer Expenditures
(PCE);
and
PCE + Gross Private Domestic Investment (GDPI) + Government
Purchases (GP) + Net Exports over Imports (NE- I) =
Gross
National Product (GNP)
An
economic indicator
is any economic statistic, such as
the GDP, inflation rate, or unemployment rate, which
indicates how well the economy
is doing
and how well
the economy
is going to do in the future
– identifying
factors that influence the buying decisions
of the
agribusiness’ clients/customers.
The agribusiness may decide to change their marketing,
production, finance, or human resource
strategies
if the
economy is going to do better or worse than previously
expected.
A
procyclic
economic indicator is one that moves in the
same direction as the economy – if economy is doing
well, number or value is usually increasing, whereas in a
recession, this indicator is decreasing [GDP is example].
A
countercyclic
economic indicator is one that moves in
the opposite direction as the economy [unemployment
rate is example as gets larger as economy gets worse].
An
acyclic
economic indicator is one that has little or no
relation to the health of the economy [are rare and
generally of little use].
A
leading
economic indicator is an indicator that changes
before the economy changes – suggests directional
changes about six months before the economy actually
changes [stock market].
A
lagged
economic indicator is one that does not change
until a few quarters after the economy does – suggests
magnitude of changes, as well as verifying directional
changes [unemployment rate].
A
roughly coincident
economic indicator is one that
moves at nearly the same time as the economy does
[GDP].
Stock market, S&P 500
Leading Economic Index (Conference Board)
Chicago Fed National Activity Index (FRB Chicago)
Bloomberg Financial Conditions Index
Daily Consumer Leading Indicators (Consumer Metrics
Institute)
Conference Board Consumer Confidence Index
Real Personal Income Levels (Bureau of Economic Analysis)
Employment & Employment Trends Index (Conference Board)
Unemployment Claims (US Department of Labor)
Existing Home Sales and Inventory Months of Supply
(National Association of Home Builders)
Commercial and Industrial Loans, by Banks
Global Trade
Oil Price
New Residential Homes Sales and Inventory Months of
Supply
Interest Rate, 30-Year Mortgage
Residential Investment (Bureau of Economic Analysis)
Inflation (Personal Consumption Price Index)
Real GDP/GDP Growth (Bureau of Economic Analysis)
Industrial Production (FRB St. Louis)
ATA Truck Tonnage Index (American Trucking Association)
WSJ Growth Forecasts (Wall Street Journal Survey)
Risk of Recession (Wall Street Journal Survey)
World Economic Growth (IMF Forecast)
Federal Surplus/Deficit (CBO Projections)
Retail Sales
CEO Economic Outlook Survey (Business Roundtable)
Value of Euro; Shanghai Stock Market
Money Supply Growth [M-2]
Bar or line charts showing quantitative time series
information.
Look for trends, cycles, seasonality, etc. for value in
forecasts as well as discuss implications of data on
agribusiness, clients/customers, policy, products/services.
Have the numerical data, if needed, to look at rates of
change or inflation effects.
To truly look at business cycles, need 2 – 3 decades.
1919, Consumer Price Index (CPI)
1923, S&P 90
1926, Hemline Index [George Taylor, economist]
1937, Gross National Product (GNP)
1940, Current Population Survey [Census]
1946, Survey of Consumer Sentiment
1951, Monthly Retail Trade Survey
1961, Index of Leading Economic Indicators (ILEI)
1967, Unemployment Insurance Claims
1986, Big Mac Index (
The Economist
)
2001, Lipstick Index (Leonard Lauder of Estee Lauder
Cosmetics)
Agribusiness economics involves microeconomics and macroeconomics, managerial decision-making, and economic forecasting to analyze and improve the performance of firms in the food and fiber production and marketing system. Economic dashboards provide real-time insights for informed decisions, while economic reports and indicators help assess economic health and trends affecting agribusiness industries. This comprehensive approach considers market dynamics, government policies, and global impacts on agribusiness operations and customer welfare.

Download Presentation

Please find below an Image/Link to download the presentation.
The content on the website is provided AS IS for your information and personal use only. It may not be sold, licensed, or shared on other websites without obtaining consent from the author.If you encounter any issues during the download, it is possible that the publisher has removed the file from their server.
You are allowed to download the files provided on this website for personal or commercial use, subject to the condition that they are used lawfully. All files are the property of their respective owners.
The content on the website is provided AS IS for your information and personal use only. It may not be sold, licensed, or shared on other websites without obtaining consent from the author.
E N D
Presentation Transcript
Forrest Stegelin Agricultural & Applied Economics University of Georgia
In management information systems, a dashboard is an easy to read, often single page, real-time user interface, showing a graphical presentation of the current status (snapshot) and historic trends of an organization s key performance indicators to enable instantaneous and informed decisions to be made at a glance. An economic dashboard is not a predictive or market timing tool regarding the future performance of any economic or financial market nor is it intended to predict or guarantee future investment performance of any sort. The dashboard is intended as a tool for agribusiness owners and managers to set context and perspective when evaluating the current state of the economy.
Microeconomics: the area of economics that deals with individual decision units people, firms, or markets within the economy. Macroeconomics: the area of economics that deals with a nation s (or industry s) economy as a whole; the study of the effects of changes in the production of goods and services and employment and how they interact to influence economic performance.
Any firm (on-farm or off-farm) involved in the food and fiber production and marketing system. The ever-changing food and agribusiness industries characterized by firms that: Move final products through the food and fiber system to the ultimate consumer or end-user; Transform raw agricultural products into the final products desired by consumers or end-users; Produce raw food and fiber products; or Supply inputs to the farm or production sector.
Managerial decision-making and problem-solving. Prognostications and forecasts and outlook. Explain and predict economic behavior influencing the need or demand for an agribusiness s products or service. Understand government programs and environmental policy, interest rates, business cycles and the economy, general mega trends, and impact of global economics on the agribusiness firms, organization, industries, and their clientele/customers. Economic reports and indicators (leading, lagging, or roughly coincident and procyclical or countercyclical) to provide metrics for evaluating the health of the economy and the agribusiness sector, the latest business cycles, an dhow the agribusiness customers are faring economically.
Business cycles, including the recession-growth pendulum swings; Inflation, and adjusting price series for inflation; Interest rates, comparing real versus nominal and adjustments to the risk free interest rates; Unemployment and the labor market; Measuring the economy s output and income; Exchange rates, as they impact trade; and Monetary and fiscal policy.
Conducting a feasibility study; Developing a marketing plan; Preparing a business plan; Forecasting sales and growth; Evaluating product or service opportunities; Completing a sensitivity analysis; Performing what-if .? scenario evaluations; Anticipating results of implementing alternative strategies; Making assumptions and evaluating risks for goals/objectives.
Perishability of inputs, raw products, and finished goods; an implied use-by date to ensure quality. Food as a product vital to the survival and health of every individual. Biological nature of production agriculture (livestock and crops). Seasonal nature of business ebbs and flows in supply and demand. Uncertainty of the weather. Types of firms function, size, legal structure, goals/purpose. Variety of market conditions risk characteristics, global/local, perfect competition, etc. Rural ties/roots and relationships in small towns and rural counties. Government involvement policies and regulations, 2014 farm bill, USDA, EPA, OSHA, HACCP, immigration, taxes, tariffs and quotas Agricultural and technological vocabularies and performance measures.
Being able to understand the economys health and direction can help guide agribusiness decisions doesn t provide succinct answers to the questions. Materials are not perfect crystal balls, but are better than operating in uncertainty about the driving forces and trends affecting agribusiness growth and investments. Many small- to medium-sized agribusinesses lose focus on the industry metrics and general economic environment because they have a micro or myopic view of the business. Does not mean provide a graduate course on macroeconomics and the money flow equations.
Gross National Product (GNP) Consumption of Fixed Capital (CFC) = Net National Product (NNP); NNP Indirect Business Taxes (IBT) + Subsidies, less current surpluses of government enterprises (S) Business Transfer Payments (BTP) = National Income (NI); NI Corporate Profits (C)P) Net Interest (I) Social Insurance Contributions (SIC) + Government Transfer Payments (GTP) + Personal Interest Paid (PIP) + Personal Dividends Paid (PDP) + BTP = Personal Income (PI); PI Personal Taxes (PT) = Disposable Personal Income (DPI); DPI Personal Savings (PS) = Personal Consumer Expenditures (PCE); and PCE + Gross Private Domestic Investment (GDPI) + Government Purchases (GP) + Net Exports over Imports (NE- I) = Gross National Product (GNP)
An economic indicator is any economic statistic, such as the GDP, inflation rate, or unemployment rate, which indicates how well the economy is doing and how well the economy is going to do in the future identifying factors that influence the buying decisions of the agribusiness clients/customers. The agribusiness may decide to change their marketing, production, finance, or human resource strategies if the economy is going to do better or worse than previously expected.
A procyclic economic indicator is one that moves in the same direction as the economy if economy is doing well, number or value is usually increasing, whereas in a recession, this indicator is decreasing [GDP is example]. A countercyclic economic indicator is one that moves in the opposite direction as the economy [unemployment rate is example as gets larger as economy gets worse]. An acyclic economic indicator is one that has little or no relation to the health of the economy [are rare and generally of little use].
A leading economic indicator is an indicator that changes before the economy changes suggests directional changes about six months before the economy actually changes [stock market]. A lagged economic indicator is one that does not change until a few quarters after the economy does suggests magnitude of changes, as well as verifying directional changes [unemployment rate]. A roughly coincident economic indicator is one that moves at nearly the same time as the economy does [GDP].
Stock market, S&P 500 Leading Economic Index (Conference Board) Chicago Fed National Activity Index (FRB Chicago) Bloomberg Financial Conditions Index Daily Consumer Leading Indicators (Consumer Metrics Institute) Conference Board Consumer Confidence Index Real Personal Income Levels (Bureau of Economic Analysis) Employment & Employment Trends Index (Conference Board) Unemployment Claims (US Department of Labor) Existing Home Sales and Inventory Months of Supply (National Association of Home Builders) Commercial and Industrial Loans, by Banks Global Trade Oil Price
New Residential Homes Sales and Inventory Months of Supply Interest Rate, 30-Year Mortgage Residential Investment (Bureau of Economic Analysis) Inflation (Personal Consumption Price Index) Real GDP/GDP Growth (Bureau of Economic Analysis) Industrial Production (FRB St. Louis) ATA Truck Tonnage Index (American Trucking Association) WSJ Growth Forecasts (Wall Street Journal Survey) Risk of Recession (Wall Street Journal Survey) World Economic Growth (IMF Forecast) Federal Surplus/Deficit (CBO Projections) Retail Sales CEO Economic Outlook Survey (Business Roundtable) Value of Euro; Shanghai Stock Market Money Supply Growth [M-2]
Bar or line charts showing quantitative time series information. Look for trends, cycles, seasonality, etc. for value in forecasts as well as discuss implications of data on agribusiness, clients/customers, policy, products/services. Have the numerical data, if needed, to look at rates of change or inflation effects. To truly look at business cycles, need 2 3 decades.
1919, Consumer Price Index (CPI) 1923, S&P 90 1926, Hemline Index [George Taylor, economist] 1937, Gross National Product (GNP) 1940, Current Population Survey [Census] 1946, Survey of Consumer Sentiment 1951, Monthly Retail Trade Survey 1961, Index of Leading Economic Indicators (ILEI) 1967, Unemployment Insurance Claims 1986, Big Mac Index (The Economist) 2001, Lipstick Index (Leonard Lauder of Estee Lauder Cosmetics)


 involved in the food")


 – Consumption of Fixed")


")
")
")