2022 Reach Codes Initiative. Advancing safer, healthier and more affordable buildings and vehicles
The 2022 Reach Codes Initiative focuses on advancing the adoption of safer, healthier, and more affordable buildings and vehicles through local enhancements to state building codes. This initiative addresses building electrification, reduced methane gas usage, and increased electric vehicle charging infrastructure readiness. Non-profit, locally-led electricity providers such as EBCE, PCE, and SVCE play a crucial role in driving these initiatives forward. The adoption process involves stakeholder engagement and council readings to effectively implement reach codes. The presentation covers topics like building electrification, EV charging infrastructure, new construction, and alterations, emphasizing technology, feasibility, costs, policy models, and available resources.
Download Presentation

Please find below an Image/Link to download the presentation.
The content on the website is provided AS IS for your information and personal use only. It may not be sold, licensed, or shared on other websites without obtaining consent from the author.If you encounter any issues during the download, it is possible that the publisher has removed the file from their server.
You are allowed to download the files provided on this website for personal or commercial use, subject to the condition that they are used lawfully. All files are the property of their respective owners.
The content on the website is provided AS IS for your information and personal use only. It may not be sold, licensed, or shared on other websites without obtaining consent from the author.
E N D
Presentation Transcript
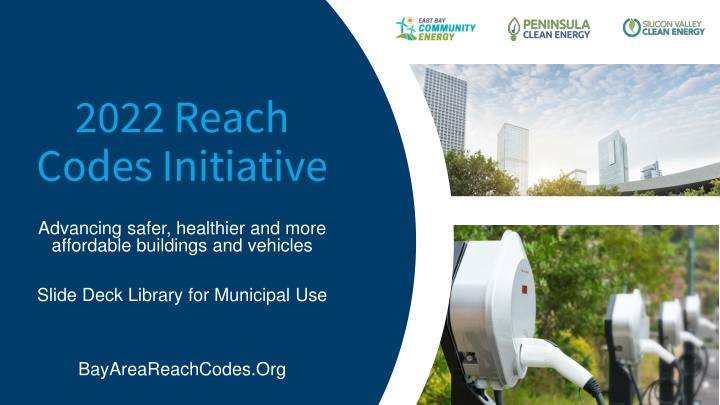
2022 Reach Codes Initiative Advancing safer, healthier and more affordable buildings and vehicles Slide Deck Library for Municipal Use BayAreaReachCodes.Org
Non-profit, locally-led electricity providers EBCE, PCE, SVCE
What are Reach Codes? Local enhancements to state code Can be adopted at any time Addresses: 1. Building electrification reduced use of methane gas 2. Electric vehicle (EV) charging infrastructure increased readiness Improves economic and energy performance of buildings Codes are enhanced by stakeholder engagement, why we are here
2019 Initiative Recap Adoption of Electrification Reach Codes East Bay Community Energy 6 9 Peninsula Clean Energy 12 9 Silicon Valley Clean Energy 12 1 Total 30 19 0 10 20 30 40 50 Adopted Not Yet Adopted 61% of member agencies 57% of electrification Reach Codes statewide 21 of 30 also had EV infrastructure codes Credit: Redwood Energy
2022 Initiative Recap Adoption of Electrification Reach Codes East Bay Community Energy 10 5 Peninsula Clean Energy 16 5 Silicon Valley Clean Energy 12 1 Total 38 11 0 10 20 30 40 50 Adopted Not Yet Adopted 78% of member agencies (so far) 30 of 38 also had EV infrastructure codes Credit: Redwood Energy
Reach Code Adoption Process File with CBSC Stakeholder Engagement (2-6 months) 1st Council Reading 2nd Council Study Session (TRC presentation) Code takes effect Council Reading
Presentation Overview Topics Building electrification Electric vehicle (EV) charging infrastructure New construction Alterations Agenda 1. Technology and feasibility 2. Costs 3. Policy models 4. Tools and Resources
Technology and Feasibility The all-electric Integrated Genomics Laboratory, Lawrence Berkeley Labs. Source: Rutherford + Chekene
Global Carbon Emissions Sources 18% Commercial & Residential Buildings 12% Road transport Source: Shayle Kann, Climate Tech VC In CA, these emissions are overwhelmingly associated with methane gas equipment that can be electrified
Electrification, Compared to Fossil Fuels Carbon-free Lowest-cost, lowest-risk pathway Healthier indoor air Job creation Source: Peninsula Clean Energy 2021
Electrification, Compared to Fossil Fuels Carbon-free Lowest-cost, lowest-risk pathway Healthier indoor air Job creation Sources: 1) AB3232 Decarbonization Assessment 2021 2) CA Energy Commission 2018 3) CPUC 2021
Electrification, Compared to Fossil Fuels Carbon-free Lowest-cost, lowest-risk pathway Healthier indoor air Job creation Sources: RMI 2020, CEC 2019
Electrification, Compared to Fossil Fuels Carbon-free Lowest-cost, lowest-risk pathway Healthier indoor air Job creation Sources: UCLA 2019, UMass 2021
California Buildings Gas Usage Dryer 2% Pools, Spas, Misc 2% Misc 9% Cooking 5% Water Heating 32% Cooking 23% Space Heating 32% Water Heating 59% Space Heating 36% Non-Residential Residential 2019 Residential Appliance Saturation Survey 2006 California Commercial End Use Survey
Electric is already the majority Of national new construction homes:1 60% use electric space heating (40% of which are heat pumps2) 55% use electric water heating 62% use electric cooking 75% use electric clothes drying Sources: 1 - 2017 American Community Survey 2 - 2017 IEA Heat Pump Conference Proceedings
Equipment Water Heating Space Heating Cooking Clothes Drying Residential Commercial
Equipment Efficiency Energy Efficiency Comparison of Technology Typical Energy Factors Natural Gas 0.8 Space heating, Water heating, Clothes drying Heat Pump 3.5 Cooking, Resistance / Induction High-Intensity Industrial Processes 1
Results: Key Takeaways All-Electric Efficient: expanded efficiency, optimal Solar All-Electric Standard: minimal efficiency, minimal solar Mixed-Fuel Home $6,000 savings Construction Cost: (compared to mixed-fuel) - $0 $13/month increase $40/month savings Bill Impact: (compared to mixed-fuel) - CO2 Impact:
Results: Details All-Electric Efficient All-Electric Standard Mixed-Fuel Home High-Efficiency Heat Pump Heat Pump Heat Pump Space Heating/Cooling: HPWH HPWH Water Heating: Natural Gas Tankless Cooking: Natural Gas Electric Resistance Electric Resistance Ceiling / Window Insulation: R-30 / U=0.3 R-49 / U=0.24 R-30 / U=0.3 Ductwork Pressure: Standard (0.45 W/CFM) Low (0.30 W/CFM) Standard 2.9 kW 5.7 kW 2.9 kW PV System:
Electrifying New Single Family Homes in the Bay Area The Cost Story Water Heater Capital: $510 Energy: $7/mo Summary All-Electric Home Capital: $10,580 Energy: $7/mo Electric Vehicle Charger Capital: Same cost, including incentives On-going: $138/mo All-Electric Home, Increased Solar Capital: Equivalent Energy: $5/mo Space Heater Capital: $2000 , assuming air- conditioning also installed Energy: $10/mo Gas Meter & Service Not Needed Capital: $6,000 Energy: $7/mo Cooktop Capital: $380 Energy: $6/mo Indoor Gas Piping Not Needed Capital: $2,450 Clothes Dryer Capital: equivalent Energy: $11/mo Annual Energy Use & Generation Capital Cost of Thermal Systems Mixed-Fuel Home 14,100 kWh Mixed-Fuel Home $29,200 Electricity All-Electric Home 9,000 kWh Gas All-Electric Home $18,620 Title 24 Solar Requirement 5,600 kWh $191 Net Lifecycle Cost Savings per year for an all-electric home versus the mixed-fuel equivalent 3 MT CO2e Carbon Emissions Savings per home, per year based on 2030 grid mix Capital and energy costs of thermal systems are based on Residential Building Electrification in California by E3 (April 2019); electricity costs assume CCA generation discount All-Electric Home, Increased Solar bill impacts are based on Low-Rise Residential New Construction 2019 Cost Effectiveness Study by Frontier Energy (August 2019) Version 8 10/21/2019
EV Charging Demand Increase in light-duty EV ownership o 250,000 EVs sold in 2021, 12.5% of all vehicles Sale of gas vehicles phased out by 2035 Pervasive issues o Costs of electrical upgrades o Underserved multi-family housing occupants Sources: California Energy Commission, EO N-79-20
EV Charging Demand AB2127 Requirements by 2030 CARB Estimates for 2030 Source: CEC and NREL, AB2127 (2021)
Cost-Benefit - Building Retrofit costs shown are best case Retrofit can be much higher PG&E retrofit 'cost-per-port ave. is $18,000 Costs include wiring, switch gear, conduit, trenching, and secondary transformer Sources: 1) Electric Vehicle Infrastructure Cost Analysis for PCE and SVCE 2) Pacific Gas and Electric Company EV Charge Network Quarterly Report, Q2 2020
Automatic Load Management 1 car charging 64A 2 cars charging 32A 32A 4 cars charging 16A 16A 16A 16A
Automatic Load Management 1 car charging 40A 2 cars charging 20A 20A
PG&E Rule 29 Starting in April 2022, multifamily and nonresidential customers are responsible only for costs associated EV charging that are downstream of the utility meter. Upstream costs will be rate-based by PG&E. Sources: PG&E Rule 29 Fact Sheet, PG&E Advice Letter 6423-E and 6424-E.
2022 Reach Code Policy Models 1.2022 California Energy Code 2.Reach codes A. Building electrification B. Electric Vehicle infrastructure 3.Discussion
2022 CA Energy Code New Construction Existing Buildings Heat pumps are prescriptive baseline Residential Space heating in climate zone 3, 4 Water heating in climate zone 12 Nonresidential water- and/or space-heating for most building types Performance credit for all-electric design Residential Pre-wiring required for gas appliances Higher ventilation rate for gas stoves Energy storage readiness Nonresidential - Solar PV and Battery Storage prescriptive Restricts newly installed electric resistance heating Simplified language for heat pump retrofits
2022 Initiative - Key Concepts Building Electrification New Construction All-Electric Municipal or Part 11 Ordinance All-electric construction required Also restricts extension of any existing gas infrastructure New construction definition If either of the below are replaced over 3 years for purposes other than repair or reinforcement 50% of above-sill framing, or 50% of foundation Optional exceptions No prescriptive pathway for building system in CA Energy Code Commercial kitchens, high-temperature industrial processes Electric-readiness required Pre-wiring Physical space Find our codes on: BayAreaReachCodes.Org
EV Code Terminology Speed Readiness Number EV Capable Level 1 3-4 miles per charging hour Percent of Parking Spaces Level 2 10-20 miles per charging hour EV Ready EV Charging Station Level 3 150+ miles per charging hour
2022 Initiative - Key Concepts EV Infrastructure New Construction 2019 CALGreen 2022 CALGreen Model Code Mandatory Mandatory 2 EV spaces total: 1 Level 2 EV Ready circuit 1 Level 1 EV Ready circuit (1) Level 2 EV Capable for one parking space per dwelling unit Single Family Homes and Two-Family Townhomes ELECTRIC VEHICLE OUTLET
2022 Initiative - Key Concepts EV Infrastructure New Construction 2019 CALGreen Mandatory 2022 CALGreen Mandatory Model code % of Parking Spaces % of Dwelling Units with Parking Spaces 10% 5% 15% 25% 40% 85% 60% 10% Multi-Family 5% Level 2 EVCS 25% Level 2 EV Ready (low-power) 10% Level 2 EV Capable 10% Level 2 EV Capable High Power Option 15% Level 2 EVCS 85% L2 EV Ready (low-power) Low Power Option 40% Level 2 EVCS 60% L1 EV Ready AUTOMATIC LOAD MANAGEMENT ENCOURAGED
100% Access is Cost Comparable Each scenario is 0.3 0.5% of construction cost EV Infrastructure Cost for 100-Dwelling Multifamily Building Assumes $392/ft2 to build per: Turner and Townsend, 2021 $227k $250,000 $194k L2 EV Capable $170k $200,000 L1 Ready $146k $150,000 Low Power L2 Ready $100,000 L2 EVCS + Load Management $50,000 L2 EVCS $- 2019 Reach Code 2022 CALGreen 2022 Reach Code - with L1 Ready 2022 Reach Code - with low power L2 % of dwellings with access 100% 40-60% 100% 100% Affordable Housing new construction is eligible for PCE incentives Low Power Option High Power Option
2022 Initiative - Key Concepts EV Infrastructure New Construction 2019 CALGreen 2022 CALGreen Model Code Mandatory Mandatory 5% 10% 6% 10% 20% 15% 30% Non-Residential Offices: 20% Level 2 EVCS 30% Level 2 EV Capable All other: 10% Level 2 EVCS 10% Level 2 EV Capable 5% Level 2 EVCS 15% Level 2 EV Capable 6% Level 2 EV Capable
2022 Initiative - Key Concepts EV Infrastructure Existing Buildings Alterations or additions Single Family Parking additions or electrical panel upgrades must meet new construction requirements When new parking facilities are added, or electrical systems or lighting of existing parking facilities are added/altered and the work requires a permit: 1. 10% of the total number of parking spaces added or altered shall be EVCS. 2. All existing EV Capable on-site shall be upgraded to minimum L1 EV Ready Multifamily Nonresidential Time certain policy (Zoning Code only) By January 1st, 2025, multifamily and nonresidential properties shall upgrade existing EV Capable spaces required by the locally adopted codes at the time the building was permitted to a minimum of Level 1 EV Ready.
Industry Resources www.AllElectricDesign.Org Provides free technical assistance on custom projects for practitioners or residents Building Electrification Technology Roadmap - Covers the technical capabilities of a variety of end-uses Building Decarbonization Practice Guide Guides architects and engineers towards best practices during design development Ecosizer Guides engineers and energy consultants for proper design of central heat pump water heating systems
EV Charging Incentives Property Category Property Type Port Type L1 or L2 outlet L2 EVSE port L1 or L2 outlet L2 EVSE port Port Incentive $2,000 $5,500 $2,500 $5,500 Applicable Cap No cap 75% of costs, up to $90k No cap Up to $90,000 Multi-Unit Dwelling Affordable Housing Multi-Unit Dwelling MUD or Affordable Housing MUD Main Panel Upgrade No cap $5,000 Existing L1 or L2 outlet L2 EVSE Port L1 or L2 outlet L2 EVSE Port Make-Ready L1 or L2 outlet No cap $2,000 $5,000 $2,000 $5,000 $2,000 $1,000 Employee Parking 75% of costs, up to $90k No cap 75% of costs, no cap Up to $20k No cap All Publicly-Accessible Non- Residential Charging All Market Rate Multi-Unit Dwelling (Above Code) Affordable Housing Multi-Unit Dwelling Up to $40,000 No cap Up to $100,000 $2,000 $1,500 $2,500 L2 EVSE port L1 or L2 outlet L2 EVSE port New L1 or L2 outlet No cap $1,000 Public Agency L2 EVSE port Up to $250,000 $2,000 Source: Peninsula Clean Energy Incentives
EV Charging Incentives Source: Silicon Valley Clean Energy Incentives Property Category Property Type Port Type Port Incentive Applicable Cap L1 outlet $1,000 Smart L1 $2,000 Multi-Unit Dwelling 75% of costs, up to $40k L2 EVSE port $4,500 Pre-wiring $2,000 Existing L1 outlet $1,000 Smart L1 $2,000 Affordable Housing Multi-Unit Dwelling 100% of costs, up to $45k L2 EVSE port $4,500 Pre-wiring $2,000 L1 or L2 outlet $1,000 Affordable Housing Multi-Unit Dwelling New 100% of costs Construction L2 EVSE port $2,000
Thank you! Next Meetings: Visit us at: BayAreaReachCodes.Org
Common Concerns (1 of 2) Concern Response Distribution grid upgrades are expensive Sometimes true. Costs are offset by savings of all-electric construction. Real problem, but gas does not help. Gas appliance ignition is electric. In emergencies gas is also shut-off. State policy for grid hardening is key. Fair Concern, but all-electric is simpler & not adopting ensures future risk. PCE and regional partners are encouraging consistency. All-electric is simple and inaction locks in future cost (retrofits, rates) and risk (fire). Resilience, power-shutoffs Uniformity In multifamily, central heat pump water heating requires more design expertise and space than gas boilers. True, training needed. There are scores of working systems, but best practice guidance is available.
Common Concerns (2 of 2) Concern Response All-Electric heating uses too much energy or can t work in our cool climate False. All-electric heat pumps are highly efficient and effective in weather far colder than ours. DOE studies show heat pump space heaters as highly efficient at as little as 5 degrees Fahrenheit. Energy is not clean False. PCE base service is 100% GHG free today Mostly false. Some scenarios for high-volume or steam applications are more challenging to address. Heat pumps and induction stoves have a long-established history, are widely adopted in other states, but market awareness needs to grow. PCE is addressing training needs. Equipment is not available
Will Electrification Reduce Resilience? Heat Pump Space Heating Heat Pump Water Heating Induction Cooking Electric Clothes Drying Gas water heaters require electronic ignition or pumps Gas furnaces require electric fans, but fireplaces still work. Gas stoves will work without electricity, but it s unsafe Gas dryers use electric motors to run tumbler
Can the Grid Handle the Load Increase? 1. Reliability is a concern only during summer peak cooling times. Increases in cooling demand are primarily due to climate change increasing summer temperatures. 2. California Energy Commission s AB3232 analysis indicates that aggressive electrification will result in 20 percent additional summer peak load through 2030. Winter load expected match summer peak load.* 3. All-electric technologies can draw power flexibly. Electric vehicles can charge during off-peak periods, water heating tanks can increase temperature ahead of peak periods, thermostat setbacks can reduce space conditioning demand, and several other approaches will avoid power outages. Source: 1) AB3232 Decarbonization Assessment 2021
Will the Grid be Reliable? 1. CEC has determined that electrification is the lower cost, lower risk approach to decarbonization, compared to all alternatives. 2. CA-ISO has performed a 20-year study and has recommended over $30B in transmission investments to account for increased renewables and decommissioned gas power plants 3. Utility-scale battery power output increased 27-fold during heatwaves from August 2020 to August 2022. Having diversity in electrical power sources has already improved grid performance. 4. The electricity suppliers have a service obligation to meet your needs. PG&E fully expects to meet the needs that all-electric buildings will require -Robert S. Kenney, Vice President, PG&E 5. The elimination of state gas subsidies will free up funding for grid hardening efforts. Sources: 1) CA Energy Commission 2018 2) CA-ISO 3) LA Times 4) 2) CPUC R1901011 2022
2019 Reach Code Initiative - Litigation Berkeley Municipal all-electric ordinance: Federal court rejected the plaintiff challenge because the ordinance does not directly regulate either energy use or energy efficiency of covered appliances. Plaintiff has appealed. Windsor Energy Code (Part 6) amendment: Agency repealed reach code because the Town could not sufficiently fund legal defense of all-electric reach code. Santa Rosa Energy Code (Part 6) amendment: CA court rejected plaintiffs claims regarding CEQA analysis for all-electric reach code. Plaintiff has appealed. 1. 2. 3. Takeaway: Pending appeals, both a municipal code or building code amendment seem legally defensible. Source: Climate Case Charts
2022 Initiative - Key Concepts Building Electrification Existing Buildings Our Approach Summarize codes and development processes Point of permit Building performance standards Point of sale Prioritize Stakeholder engagement Building stock assessment Financing strategy Policy considerations Develop code for low- hanging fruit Air-conditioning installations, new pool permits End of flow date Reference useful tools Statewide Utility Program Cost-effectiveness studies Electric-preferred retrofit ordinance BayREN Policy Calculator
Natural Gas Costs Climbing CA residential natural gas prices increased 3x faster than electricity prices from 2012 to 2018 Trend expected to accelerate: CA Residential Gas and Electricity Prices +4.6%/y 134 Gas 131 128 126 123 Electricity 110 102 109 109 107 106 106 100 100 +1.4%/y 2012 = 100 2012 2013 2014 2015 2016 2017 2018 CEC Workshop June 6, 2019: Draft Results from E3 study on the Future of Natural Gas Distribution in California Source: EIA https://www.eia.gov/dnav/ng/hist/n3010ca3m.htm https://www.eia.gov/electricity/data/browser/#/topic/7?agg=2,0,1&geo=g&freq=M The AB3232 Report represents the most current CEC research supporting that Aggressive Electrification is the primary pathway to meeting GHG reduction targets.
Stoves: Consumer Reports Prefers Induction 6 of top 8 Ranges for 2020 were electric, top 2 were Induction
