10X Single Cell RNA-Seq Analysis


Analysing 10X Single Cell RNA-Seq
Data
v2023-01
Simon Andrews
simon.andrews@babraham.ac.uk

Course Outline
•
How 10X single cell RNA-Seq works
•
Evaluating CellRanger QC
–
[Exercise] Looking at CellRanger QC reports
•
Dimensionality Reduction (PCA, tSNE, UMAP)
–
[Exercise] Using the Loupe cell browser
•
R Frameworks for scRNA analysis
–
[Exercise] Analysing data in R using Seurat
How 10X RNA-Seq Works
Cells
Barcoded Beads
Oil
RT
Reagents
Gel Beads in Emulsion (GEMs)
How 10X RNA-Seq Works
How 10X RNA-Seq Works
AAAAAGATTCGTAGTGCTGATGCT...
Reverse Transcription
Mix RNAs
and Cells
Illumina Library Prep
How 10X RNA-Seq Works
Illumina
Adapter
Illumina
Adapter
UMI
Cell
Barcode
3’ RNA Insert
Sample
Barcode
Read 1
Read 2
Read 3
10X Produces Barcode Counts
UMIs are finally related to genes to get per-gene counts
Extension Techniques
•
Variants of the basic protocol which allow for other measures
•
Introduce artificial sequences which are measured alongside
the normal RNAs
–
Cell Surface Markers
–
CRISPR guide RNAs
•
Beads use custom captures (in addition to TTTT)
•
Attach sequences to sgRNA or tag to antibodies
The 10X Software Suite
Chromium
Controller
Cell
Ranger
Loupe
Browser
Runs the chromium
system for creating
GEMs
Pipeline for
mapping, filtering,
QC and quantitation
of libraries
Desktop software for
visualisation and
analysis of single cell
data.
Cell Ranger
FastQ Files
Cell Barcode
Extraction
UMI
Extraction
Reference
Alignment
Gene
Assignment
Deduplication
Count table
tSNE
UMAP
Clustering
Markers
CellRanger
Alternatives
StarSolo gives virtually identical
results more quickly, but no Loupe
integration
Pseudo-alignments are much quicker,
but generate artefacts and won't
include intronic data
CellRanger Commands
•
I1
–
Index file. Sets of 4 barcodes per
sample
•
R1
–
Barcode reads
•
16bp cell level barcode
•
10bp UMI
•
R2
–
3’ RNA-seq read
scrALI001_S1_L001_I1_001.fastq.gz
scrALI001_S1_L001_R1_001.fastq.gz
scrALI001_S1_L001_R2_001.fastq.gz
CellRanger Commands
•
CellRanger Count (quantitates a single run)
$ cellranger count --id=COURSE \
--transcriptome=/bi/apps/cellranger/references/GRCh38/ \
--fastqs=/bi/home/andrewss/10X/ \
--localcores=8 \
--localmem=32
•
CellRanger aggr (merges multiple runs)
$ cellranger aggr --id=MERGED \
--csv=merge_me.csv \
--normalize=mapped
CellRanger Aggregate CSV file
Required
Optional
Output files generated
•
web_summary.html
-
Web format QC report
•
filtered_feature_bc_matrix.h5
Single file of cell counts
•
filtered_features_bc_matrix
–
barcodes.tsv.gz
-
cell level barcodes seen in this sample
–
features.tsv.gz
-
list of quantitated features (usually Ensembl genes)
–
matrix.mtx.gz
-
(sparse) matrix of counts for cells and features
•
possorted_genome_bam.bam
BAM file of mapped reads
•
molecule_info.h5
Details of the cell barcodes – used for
merging, can also use for analysis
•
cloupe.cloupe
Analysis data for Loupe Cell browser
Evaluating CellRanger Output
•
Look at barcode splitting report
–
Check sample level barcodes
•
Look at
web_summary.html
file
–
Check number of cells
–
Check quality of data
–
Check coverage per cell
–
Check library diversity
Sample Level Barcodes
•
Only present if multiple
libraries mixed in a lane
•
Get standard barcode split
report, but with 4
barcodes used per sample
•
Even coverage within and
between libraries
CellRanger Reports
•
HTML report – comes with each sample and aggregated group
of samples
•
Gives some basic metrics to judge the quality of the samples
and spot any issues in the data or processing
Errors and Warnings
How many cells do you have?
•
Cell number is determined from the number of cell barcodes
with ‘reasonable’ numbers of observations
•
Need to separate signal from background – real cell associated
barcodes vs noise from empty GEMs and mis-called sequences
•
Changing the thresholds used can give very different
predictions for cell numbers
How many cells do you have?
•
Start by looking at the quality of the base calls in the barcodes
•
Bad calls will lead to inaccurate cell assignments
How many cells do you have
•
Plot of UMIs (reads) per
cell vs number of cells
•
Blue region was called as
valid cells
•
Grey region is considered
noise
•
Both axes are log scale!!!
How many cells do you have
5000 reads per cell. 10k cells
500 reads per cell. 15k cells
CellRanger v3 uses a liberal cutoff to define cells. This was
designed to accommodate (normally cancer) samples where cells
might have wildly different amounts of RNA. It will include large
numbers of cells with small numbers of UMIs. If this doesn’t
apply to your sample then this will over-predict valid cells.
How much data do you have per cell?
•
Reads should map well
•
Check reads are mostly in transcripts
•
Means and medians can be misleading
when cells are variable
•
Note difference between read and UMI
How much data do you have per cell?
•
Some details about mapping
–
Reads should map to the 3’ end of transcripts (oligo dT selection)
–
Reads count as exonic if 50% of them overlaps an exon
–
Multi-mapped reads which only hit one exon are considered to be
uniquely mapped
–
Reads associate with genes based on overlap and direction
–
Only confident (unique) transcriptome reads are used for analysis. As of
CellRanger v7 intronic reads as well as exonic are counted by default
How much data do you have per cell?
•
Difficult to generalise how much data to create/expect
–
Depends on cell type, genome and other factors
•
In general though, sensible numbers would be:
–
Reads per cell ~10,000
–
Genes per cell 2000 – 3000
•
Be aware of the difference between reads (raw) and UMIs
(deduplicated) – they can be
very
different
How deeply sequenced is your library
How deeply sequenced is your library
How deeply sequenced is your library
•
Expected diversity varies by cell type
Figure from 10X Genomics 2018
Is coverage variation affecting your data?
Aggregation QC
•
Web Summary with added “Aggregation” section
•
Aggregation ‘normalisation’ is done via sub-sampling to get even
coverage
•
Can be problematic if libraries are of different sizes (especially is
one is really small)
Aggregation QC
Exercise – Evaluating CellRanger Reports
•
Look at the selection of CellRanger reports to get an idea for the
metrics they provide
–
Is the quality of the data good
–
How many cells are there
–
How much data per cell is there (both UMIs and Genes)
–
Is there any separation? Is it driven by amount of data?
•
The data we’re going to use for the rest of the day is in
“
course_web_summary.html
”, do you see any problems which
would concern us with this data at this stage?
Course Data CellRanger QC
Course Data QC – Read1 (Barcodes)
Course Data QC – Read2 (RNA)
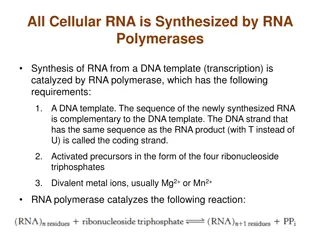
This content delves into the intricacies of analyzing 10X single-cell RNA-Seq data, covering topics such as how 10X RNA-Seq works, evaluating CellRanger QC reports, dimensionality reduction techniques like PCA, tSNE, and UMAP, using the Loupe cell browser, and frameworks for scRNA analysis in R. It also explores extension techniques that introduce artificial sequences for additional measures and discusses how 10X produces barcode counts, which are related to genes to obtain per-gene counts. The course outline and images provide a comprehensive overview of the processes involved in 10X single-cell RNA-Seq analysis.

Download Presentation

Please find below an Image/Link to download the presentation.
The content on the website is provided AS IS for your information and personal use only. It may not be sold, licensed, or shared on other websites without obtaining consent from the author.If you encounter any issues during the download, it is possible that the publisher has removed the file from their server.
You are allowed to download the files provided on this website for personal or commercial use, subject to the condition that they are used lawfully. All files are the property of their respective owners.
The content on the website is provided AS IS for your information and personal use only. It may not be sold, licensed, or shared on other websites without obtaining consent from the author.
E N D
Presentation Transcript
Analysing 10X Single Cell RNA-Seq Data v2023-01 Simon Andrews simon.andrews@babraham.ac.uk
Course Outline How 10X single cell RNA-Seq works Evaluating CellRanger QC [Exercise] Looking at CellRanger QC reports Dimensionality Reduction (PCA, tSNE, UMAP) [Exercise] Using the Loupe cell browser R Frameworks for scRNA analysis [Exercise] Analysing data in R using Seurat
How 10X RNA-Seq Works RT Oil Reagents Cells Barcoded Beads Gel Beads in Emulsion (GEMs)
How 10X RNA-Seq Works Oligo dT UMI (all different) Cell barcode (same within GEM) Priming site
How 10X RNA-Seq Works AAAAAGATTCGTAGTGCTGATGCT... Reverse Transcription Mix RNAs and Cells Oligo dT UMI (all different) Cell barcode (same within GEM) Priming site Illumina Library Prep
How 10X RNA-Seq Works Read 1 Read 3 Illumina Adapter Cell Illumina Adapter Sample Barcode UMI 3 RNA Insert Barcode Read 2 Sample level barcode same for all cells and RNAs in a library Cell level barcode (16bp) same for all RNAs in a cell UMI (10bp) unique for one RNA in one cell
10X Produces Barcode Counts Sample WT Sample KO Cell WT B Cell WT C Cell KO B Cell KO C Cell WT A Cell KO A UMI UMI UMI UMI UMI UMI UMI UMI UMI UMI UMI UMI UMI UMI UMI UMI UMI UMI UMI UMI UMI UMI UMI UMI UMI UMI UMI UMI UMI UMI UMI UMI UMI UMI UMI UMI UMI UMIs are finally related to genes to get per-gene counts
Extension Techniques Variants of the basic protocol which allow for other measures Introduce artificial sequences which are measured alongside the normal RNAs Cell Surface Markers CRISPR guide RNAs Beads use custom captures (in addition to TTTT) Attach sequences to sgRNA or tag to antibodies
The 10X Software Suite Chromium Controller Cell Ranger Loupe Browser Runs the chromium system for creating GEMs Pipeline for mapping, filtering, QC and quantitation of libraries Desktop software for visualisation and analysis of single cell data.
Cell Ranger Cell Barcode Extraction UMI FastQ Files Extraction Gene Reference Alignment Deduplication Assignment tSNE UMAP Clustering Markers Count table
CellRanger Alternatives StarSolo gives virtually identical results more quickly, but no Loupe integration Pseudo-alignments are much quicker, but generate artefacts and won't include intronic data
CellRanger Commands I1 scrALI001_S1_L001_I1_001.fastq.gz scrALI001_S1_L001_R1_001.fastq.gz scrALI001_S1_L001_R2_001.fastq.gz Index file. Sets of 4 barcodes per sample R1 Barcode reads 16bp cell level barcode 10bp UMI R2 3 RNA-seq read
CellRanger Commands CellRanger Count (quantitates a single run) $ cellranger count --id=COURSE \ --transcriptome=/bi/apps/cellranger/references/GRCh38/ \ --fastqs=/bi/home/andrewss/10X/ \ --localcores=8 \ --localmem=32 CellRanger aggr (merges multiple runs) $ cellranger aggr --id=MERGED \ --csv=merge_me.csv \ --normalize=mapped
CellRanger Aggregate CSV file Required Optional library_id molecule_h5 sex genotype WT1 /data/WT1/outs/molecule_info.h5 Male WT WT2 /data/WT2/outs/molecule_info.h5 Female WT WT3 /data/WT3/outs/molecule_info.h5 Male WT WT4 /data/WT4/outs/molecule_info.h5 Female WT KO1 /data/KO1/outs/molecule_info.h5 Male KO KO2 /data/KO2/outs/molecule_info.h5 Female KO KO3 /data/KO3/outs/molecule_info.h5 Male KO KO4 /data/KO4/outs/molecule_info.h5 Female KO
Output files generated web_summary.html - Web format QC report Single file of cell counts filtered_feature_bc_matrix.h5 filtered_features_bc_matrix barcodes.tsv.gz - features.tsv.gz - matrix.mtx.gz - cell level barcodes seen in this sample list of quantitated features (usually Ensembl genes) (sparse) matrix of counts for cells and features possorted_genome_bam.bam BAM file of mapped reads molecule_info.h5 Details of the cell barcodes used for merging, can also use for analysis cloupe.cloupe Analysis data for Loupe Cell browser
Evaluating CellRanger Output Look at barcode splitting report Check sample level barcodes Look at web_summary.html file Check number of cells Check quality of data Check coverage per cell Check library diversity
Sample Level Barcodes Only present if multiple libraries mixed in a lane Get standard barcode split report, but with 4 barcodes used per sample Even coverage within and between libraries
CellRanger Reports HTML report comes with each sample and aggregated group of samples Gives some basic metrics to judge the quality of the samples and spot any issues in the data or processing
How many cells do you have? Cell number is determined from the number of cell barcodes with reasonable numbers of observations Need to separate signal from background real cell associated barcodes vs noise from empty GEMs and mis-called sequences Changing the thresholds used can give very different predictions for cell numbers
How many cells do you have? Start by looking at the quality of the base calls in the barcodes Bad calls will lead to inaccurate cell assignments
How many cells do you have Plot of UMIs (reads) per cell vs number of cells Blue region was called as valid cells Grey region is considered noise Both axes are log scale!!!
How many cells do you have 5000 reads per cell. 10k cells 500 reads per cell. 15k cells CellRanger v3 uses a liberal cutoff to define cells. This was designed to accommodate (normally cancer) samples where cells might have wildly different amounts of RNA. It will include large numbers of cells with small numbers of UMIs. If this doesn t apply to your sample then this will over-predict valid cells.
How much data do you have per cell? Reads should map well Check reads are mostly in transcripts Means and medians can be misleading when cells are variable Note difference between read and UMI
How much data do you have per cell? Some details about mapping Reads should map to the 3 end of transcripts (oligo dT selection) Reads count as exonic if 50% of them overlaps an exon Multi-mapped reads which only hit one exon are considered to be uniquely mapped Reads associate with genes based on overlap and direction Only confident (unique) transcriptome reads are used for analysis. As of CellRanger v7 intronic reads as well as exonic are counted by default
How much data do you have per cell? Difficult to generalise how much data to create/expect Depends on cell type, genome and other factors In general though, sensible numbers would be: Reads per cell ~10,000 Genes per cell 2000 3000 Be aware of the difference between reads (raw) and UMIs (deduplicated) they can be very different
How deeply sequenced is your library Expected diversity varies by cell type Figure from 10X Genomics 2018
Aggregation QC Web Summary with added Aggregation section Aggregation normalisation is done via sub-sampling to get even coverage Can be problematic if libraries are of different sizes (especially is one is really small)
Exercise Evaluating CellRanger Reports Look at the selection of CellRanger reports to get an idea for the metrics they provide Is the quality of the data good How many cells are there How much data per cell is there (both UMIs and Genes) Is there any separation? Is it driven by amount of data? The data we re going to use for the rest of the day is in course_web_summary.html , do you see any problems which would concern us with this data at this stage?
Course Data CellRanger QC Actual Problem Value Reported


")
")