IT and Digital Service Support Performance Overview February 2022

Performance overview of IT and digital service support in February 2022 including incident response, resolution change success rate, ticket volumes, mean time to resolution, customer satisfaction, availability of critical services, and more. The data provides insights into response and resolution efficiency, service reliability, success rates, and challenges faced. Analysis indicates a recovery in performance from previous months with a focus on clearing aged tickets to improve SLA performance.

Download Presentation

Please find below an Image/Link to download the presentation.
The content on the website is provided AS IS for your information and personal use only. It may not be sold, licensed, or shared on other websites without obtaining consent from the author. Download presentation by click this link. If you encounter any issues during the download, it is possible that the publisher has removed the file from their server.
E N D
Presentation Transcript
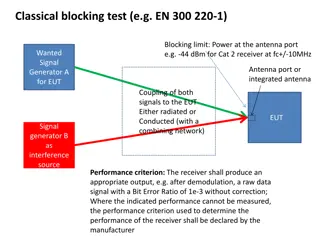
IT and Digital Service Support Performance February 2022 Incident Response Response Resolution Change Success Rate 120% 90 97%91%96% 79 89%94% 78 86%91%94%91%92%95% 73 80 100% 71 70 85% 68 82% 67 63 70 62 57 80% 60 50 45 50 60% 36 40 40% 30 20 9 9 20% 8 8 8 7 7 6 5 4 3 10 2 2 0 0% Completed with no issues Issues or Rolled Back Success rate Ticket Volumes by Channel Mean Time to Resolution Knowledge Article Views 12000 Article views per month 10000 7000 8000 6000 5000 6000 4000 4000 3000 2000 2000 0 1000 0 Email Phone Out of Hours Internal portal Customer portal Face to Face Live chat Self-Service
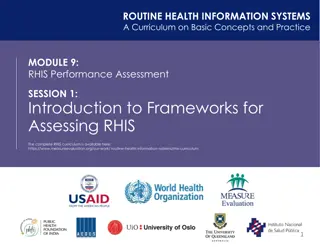
IT and Digital Service Support Performance February 2022 Tickets Chased Tickets Reopened Customer Satisfaction Volumes of Open Tickets by Age End of February 2022
IT and Digital Service Level Overview Critical Services February 2022 Compared to last Month Compared to last Month Availability SLA Availability Result Reliability SLA Reliability Result Service Comment Student Records Management Met Met 0 100% Timetabling Met Met 0 100% Student Portal Met Met 0 100% SAP Payroll Met Met 0 100% Core Network Met Met 0 100% 09/02/22 12:00 14:00: Users were prompted to reauthenticate for services, and may have been temporarily disconnected from others (e.g. Outlook) Identity Management Not Met Met 1 99.7% Data Centre Environments Met Met 0 100% Virtual Learning Environment Met Met 0 100% Classroom Technology Met Met 0 100% Wireless Network Met Met 0 100% Office 365 Met Met 0 100% Remote Access Met Met 0 100%
IT and Digital Service Support Performance Dashboard Explained Response Resolution Change Success Rate Description: Time until the ticket is moved into In Progress, based on the following targets: Description: Time to resolve a ticket from creation, based on the following targets: Description: 13-month high level view of whether IT changes have been performed with no issues, some issues or major issues. The categorisation is based on the following info: Priority R1 R2 R3 R4 R5 R6 Time to Assign 4 hours 1 working day 2 working days 2 working days 2 working days 2 working days Priority R1 R2 R3 R4 R5 R6 Time to Resolve 1 working day 2 working days 5 working days 10 working days 4 weeks 12 weeks Priority 1 Critical 2 High 3 Medium 4 - Low 5 - Minor Time to Assign 15 mins 30 mins 2 hours 1 day 2 days Priority 1 Critical 2 High 3 Medium 4 - Low 5 - Minor Time to Resolve 2 Hours 4 Hours 1 day 3 days 5 days Note: Success rate % only includes changes completed with NO issues out of total number of changes attempted. Excludes Pre-Authorised Changes prior to August 2019. Report Status Completed with no issues Actual Change Status Completed with no issues Completed with minor issues Cancelled Completed with major issues Rolled back Failed Minor issues or cancelled Major issues or rolled back Comments and data observations: Clearing aged tickets was a priority across ISDS since June 2021, which means we have seen a significant downturn in Response and Resolution SLA performance across all departments. We can see that we are recovering from this July onwards. Comments and data observations: Clearing aged ticket backlogs was a priority across ISDS since June 2021; work is on-going to look at our Incident and Service Request targets, and review whether are Resolution target times are appropriate. Comments and data observations: 45 completed with no issues, 8 with issues, for a success rate of 85%. There was 9 Emergency Changes, and 9 Pre-Authorised Changes. Ticket Volumes by Channel Mean Time to Resolution Customer Satisfaction Description: Responses to our customer satisfaction survey at the end of each ticket resolution. Excludes face to face feedback cards and Live Chat surveys. Description: 13-month view of the total number of cases in our ITSM tool, processed by the IT Helpline per month, per channel. Description: 13-month view of Mean Time to Resolution. Calculation: Average of duration between the creation and resolution of all tickets (including both Incidents and Service Requests) on per-month basis. The time tickets were in Pending for is subtracted from the overall duration. Calculation: The number of customers who responded with either highly satisfied or satisfied, versus the number of customers who responded with unsatisfied or highly unsatisfied. Includes feedback for all ISDS teams. Calculation: Includes all incidents, service requests and requests for information, and cases recorded by NorMAN (our Out of Hours service). Comments and data observations: Total number of tickets logged was 5141, representing a significant decrease year on year of 1059 (excluding IT Rover tickets). 1585 tickets were logged through the Assist Portal, representing 30% of all tickets logged (up from 16% in February 2021). Comments and data observations: Average MTTR for February 2022 was 26 hours. MTTR is generally high in the month following a busy period (for example February and October following the start of term). As such, we would expect MTTR to be low in January. Comments and data observations: Feedback received for Cherwell tickets is analysed and shared with the relevant teams each month. Customers who were unsatisfied are contacted by the responsible team or the Service Management Office.
IT and Digital Service Level Performance Explained Urgency = Preconfigured in Cherwell 1 2 Availability Target 3 Incident Prioritisation Measuring the total uptime of the entire service, availability refers to that time when the service can be utilised by users in accordance with the definition incorporated in the service catalogue. Critical service Essential service Supporting service Global impact, affecting more than 80% of users of a service OR Potential of affecting more than 1,000 people AND Affecting more than 80% of system functionality Impact = Selected Manually 1 1 2 4 Availability target 99.9% Reliability Target Affecting 20%-80% of users of a service OR Affecting critical piece of system functionality OR Affecting more than 10 people OR Teaching emergency 2 2 3 5 Reliability focuses on minimising the number of outages the University experiences, regardless of duration, during designated periods with regard to specific services. Affecting less than 10 people OR Affecting non-critical functionality of the system OR Single printer / single PC 3 4 5 5 Number of outages per month <2 Availability and reliability reporting explained: Only Business Critical services are included in the report Measured & reported monthly, calculated on a 24/7 basis Any downtime approved in advance via the IT Change Management process is excluded from these calculations Downtime is recorded and reported manually, i.e. not via an automated monitoring system Availability and reliability comments and data observations: The disruption to Identity Management affected Account Reset Utility, UCMe, and Outlook. The issue related to patches being applied on our Domain Controllers, and caused 40 tickets to be logged with the IT Service Desk.