Understanding 95% Confidence Intervals in Statistics
Confidence intervals are a key concept in statistics that provide a range within which the true value of an estimate is likely to fall. This video series explores the interpretation of 95% CIs, compares them to standard error and standard deviation, and explains how sample size and standard deviatio
2 views • 8 slides
Understanding Normal Distribution in Statistics Education
Lesson resources for teachers to teach students about analyzing and understanding normal distribution in statistics. Includes learning standards, agenda, presentation, vocabulary activities, and additional resources. Emphasizes using mean and standard deviation to fit data to a normal distribution,
10 views • 23 slides
Understanding Normal Conditions of Use for New Propulsion Technologies in Vehicles
Explore the concept of normal conditions of use for vehicles with new propulsion/charging technologies. Learn how to assess and define normal conditions, operating modes, worst case scenarios, and overview of current technologies. Discover the approach to measure normal conditions and testing requir
1 views • 8 slides
Understanding the Significance Testing Process for Population Means
Learn how to test claims about population means, including checking conditions, calculating test statistics, finding P-values, and understanding t-distributions and degrees of freedom. This lesson covers the Random and Normal/Large Sample conditions for significance tests, the modeling of standardiz
0 views • 10 slides
Normal Flora of Human Body
Normal flora, comprising bacteria and fungi, are beneficial residents of specific body sites like the skin, colon, and vagina. These organisms, known as commensals, play a vital role in maintaining a healthy microbial balance. The internal organs are usually sterile, while different types of normal
2 views • 16 slides
Understanding Process Costing in Manufacturing Industries
Process costing is a widely used method in mass production industries like steel and chemicals. It involves accumulating costs process-wise for standardized products resulting from sequential operations. Essential characteristics include continuous production, standardized products, and handling nor
1 views • 18 slides
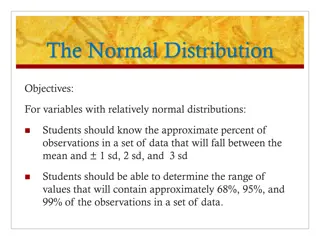
Understanding Data Distribution and Normal Distribution
A data distribution represents values and frequencies in ordered data. The normal distribution is bell-shaped, symmetrical, and represents probabilities in a continuous manner. It's characterized by features like a single peak, symmetry around the mean, and standard deviation. The uniform distributi
1 views • 23 slides
Understanding Normal Distribution and Its Business Applications
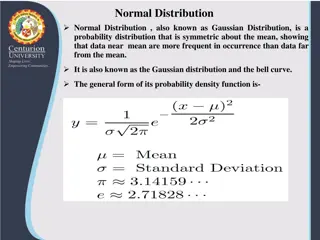
Normal distribution, also known as Gaussian distribution, is a symmetric probability distribution where data near the mean are more common. It is crucial in statistics as it fits various natural phenomena. This distribution is symmetric around the mean, with equal mean, median, and mode, and denser
1 views • 8 slides
Understanding Standard Deviation, Variance, and Z-Scores
Explore the importance of variation in interpreting data distributions, learn how to calculate standard deviation, understand z-scores, and become familiar with Greek letters for mean and standard deviation. Discover the significance of standard deviation in statistical analysis and the difference b
1 views • 18 slides
Understanding the Standard Normal Distribution in Statistics
Exploring the significance of normal distributions in statistics, this lesson covers the 68-95-99.7 rule, using Table A to find probabilities and z-scores, properties of normal curves, and the standard normal distribution. Key concepts include the mean, standard deviation, and how to standardize var
4 views • 9 slides
Understanding Normal Distribution Calculations in Statistics
Exploring normal distribution calculations in Statistics involves calculating probabilities within intervals and finding values corresponding to given probabilities. This lesson delves into the application of normal distribution to determine probabilities of scoring below a certain level on tests an
1 views • 13 slides
Understanding Normal Distribution in Probability
Explore the properties and characteristics of the normal distribution, including the mode, symmetry, inflection points, and the standard normal distribution. Learn how to use standard normal tables to find probabilities and areas under the curve. Practice using examples to calculate probabilities ba
1 views • 35 slides
Understanding Behavioral Finance in "Finance for Normal People
Delve into the world of behavioral finance as presented in "Finance for Normal People," exploring how investors and markets behave based on cognitive and emotional factors. The book covers topics such as cognitive shortcuts and errors, emotional biases, and correcting investment mistakes. It also di
0 views • 20 slides
Workplace Exposure Standard for Silica Dust in Stone Benchtop Fabrication
Reduction in workplace exposure standard for respirable crystalline silica dust has been implemented, halving the national standard to 0.05 mg/m3. The new standard aims to protect workers in stone benchtop fabrication businesses from serious lung diseases caused by breathing in silica dust. Employer
1 views • 8 slides
Understanding Outlier Analysis in Data Mining
Outliers are data objects that deviate significantly from normal data, providing valuable insights in various applications like fraud detection and customer segmentation. Types of outliers include global, contextual, and collective outliers, each serving distinct purposes in anomaly detection. Chall
0 views • 44 slides
Case Study: 1-Year-Old Child Undergoing CT Cisternography for Head Injury Evaluation
A 1-year-old female child presented with a history of head injury and rhinorrhea. No other significant symptoms were observed, and the child was deemed stable for CT cisternography under general anesthesia. Normal systemic and general examination findings were noted, and standard anesthesia monitori
0 views • 22 slides
Understanding the Normal Microbial Flora of the Human Body
The normal microbial flora, also known as the indigenous microbiota, inhabit various areas of the human body such as the gastrointestinal tract, respiratory tract, genitourinary tract, and skin. They play a crucial role in maintaining health and can re-establish themselves when disturbed. While resi
0 views • 22 slides
Understanding and Managing Normal.dotm in Microsoft Word
Learn about Normal.dotm in Microsoft Word, the default template for new documents. Find out how to locate, create, modify, and deal with corrupted Normal.dotm files. Explore the importance of Normal.dotm in customizing your Word documents efficiently.
0 views • 19 slides
Standard of Care for Peripheral Lesion Assessment with Normal Hilar and Mediastinal Appearances
Assessing patients with peripheral lesion on staging CT with normal hilar and mediastinal findings. Further investigation with contrast-enhanced CT is recommended for fitness evaluation and treatment planning. Biopsy methods, diagnostic criteria, and considerations for nodules and nodal staging are
4 views • 5 slides
Understanding the Normal Probability Curve
The Normal Probability Curve, also known as the normal distribution, is a fundamental concept in statistics. It is symmetric around the mean, with key characteristics such as equal numbers of cases above and below the mean, and the mean, median, and mode coinciding. The curve's height decreases grad
0 views • 10 slides
Understanding Normal and Abnormal Behavior: Perspectives and Definitions
Normal behavior varies from person to person and society, influenced by individual preferences and societal norms. Abnormal behavior is characterized by an inability to function effectively or personal discomfort. The concept of normality and abnormality in psychology raises complex questions about
2 views • 8 slides
Understanding the Central Limit Theorem in Statistics
This lesson covers the Central Limit Theorem, which states that the sampling distribution of a sample mean becomes approximately normal as the sample size increases, regardless of the population distribution. It explains how the distribution of sample means changes shape and approaches a normal dist
0 views • 7 slides
Understanding Normal Forms in Propositional Logic
Explore the concept of normal forms in propositional logic, where each formula has a unique truth-value function. Learn about equivalence of formulas, determining normal forms, and canonic forms like Disjunctive Normal Form (DNF) and Conjunctive Normal Form (CNF). Discover how to find canonic forms
1 views • 22 slides
Linking BIM and GIS Standard Ontologies with Linked Data
Introduction to the need for seamless data interpretation between Building Information Model (BIM) and Geographic Information System (GIS), focusing on aligning BIM and GIS standard ontologies for semantic interoperability. Addressing the challenges of data interoperability layers and the characteri
0 views • 15 slides
Understanding Normal Parturition: The Stages and Processes
Normal parturition, also known as childbirth, involves several stages including uterine contractions, cervix dilatation, fetal positioning, and the weakening of the placental connection. The process gradually prepares the birth canal for delivery, with the fetus assuming a specific position for birt
1 views • 19 slides
Probability and Normal Distribution Exercises
Solving exercises related to normal distribution and probability, including calculating probabilities based on mean and standard deviation, determining minimum guaranteed mileage for a tire company, and interpreting test scores. Utilizes data on IQ test scores and tire mileage to illustrate concepts
0 views • 5 slides
Comprehensive Guide to the Management of Normal Labor by Professor Muhsin-AL-Sabbak
Understanding the management of normal labor is crucial for healthcare professionals. This comprehensive guide covers the definition of normal vaginal delivery, diagnosis of labor, stages of labor, phases of labor, and the use of tools like partogram and cardiotocography to monitor progress. Profess
0 views • 9 slides
Understanding Normal Labour in Pregnancy
Labour is the natural process of expelling a mature foetus from the uterus. Criteria for normal labour include spontaneous expulsion of a single, mature foetus within a reasonable time frame without complications. Various theories explain the onset of labour, such as hormonal factors and mechanical
0 views • 35 slides
Understanding Uncertainty with Estimation and Standard Error
Explore the concept of estimating with uncertainty, focusing on calculating a mean and using standard error to describe the uncertainty in that mean. Delve into human height, a variable described by a normal distribution, to understand how samples may deviate from the true mean. Discover sampling er
0 views • 13 slides
Understanding Normal Distribution in Statistical Problems
Explore various scenarios involving normal distributions, such as calculating probabilities, determining population percentages, estimating standard deviations, and analyzing ranges of values. Practical examples include math test scores, rattlesnake lengths, car speeds, jelly bean quantities, and mo
0 views • 29 slides
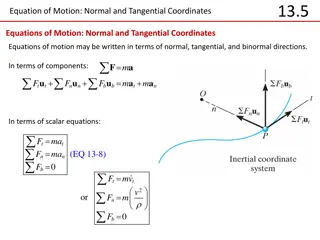
Equations of Motion in Normal and Tangential Coordinates
Equations of motion can be expressed in terms of normal, tangential, and binormal directions. The normal and tangential components play crucial roles in describing the motion of an object. Through scalar equations and component representations, these equations help analyze forces and acceleration in
0 views • 8 slides
Understanding the Anderson-Darling Normality Test
Conducting the Anderson-Darling Normality Test helps determine if a set of continuous data follows a normal distribution. The test involves comparing the sample data distribution with a standard normal distribution and evaluating the p-value to either accept or reject the null hypothesis. By collect
0 views • 5 slides
Understanding the Normal Distribution in Data Analysis
The normal distribution, also known as the bell-shaped or Gaussian distribution, is defined by the mean and standard deviation of quantitative data. It helps determine the range of values containing specific percentages of observations. Identifying frequency, probability, mean, and the relationship
0 views • 19 slides
Modernizing Statistics Education: From Tables to Software
Sections 6.5 to 6.7 of the course material discuss the transition from using tables for calculations to modern tools like calculators and software such as Excel in statistics education. The focus is on converting to and from standard normal, utilizing Excel functions effectively, and understanding n
0 views • 21 slides
Understanding Normal Reference Range and Descriptive Statistics in Medicine
The concept of normal reference range in medicine, determined by collecting data from a population, helps predict intervals where values are expected to fall. Descriptive statistics like mean, variance, skewness, and kurtosis provide insights into data distributions. Methods for calculating referenc
0 views • 45 slides
Understanding Standard Molar Enthalpies of Formation
Formation reactions involve substances being created from elements in their standard states, with the enthalpy change known as the standard molar enthalpy of formation (Hf). This enthalpy represents the energy released or absorbed when one mole of a compound is formed from its elements in their stan
0 views • 13 slides
Rainbow-Inclusive Workplaces Standard: Promoting Diversity in Employment
The Rainbow-Inclusive Workplaces Standard (NZS 8200:2015) is a groundbreaking initiative in New Zealand, setting guidelines for organizations to create inclusive and safe workplaces for individuals of diverse sexual orientations and gender identities. The standard aims to address discrimination and
0 views • 30 slides
Understanding Standard Deviation in AP Biology
Standard deviation is a crucial concept in biology that helps analyze variability and distribution of data. This summary provides insights into within-group and between-group variations, normal distribution, and steps to calculate standard deviation using examples and formulas.
0 views • 18 slides
Understanding Standard Deviation and Standard Error of the Means
Standard deviation measures the variability or spread of measurements in a data set, while standard error of the means quantifies the precision of the mean of a set of means from replicated experiments. Variability is indicated by the range of data values, with low standard deviation corresponding t
0 views • 7 slides
Understanding Displacement, Deformation, and Normal Strain in Mechanics of Materials
Displacement and deformation in materials play a crucial role when loads are applied, leading to normal strain. This lecture discusses the concepts of displacement, deformation, and strain, covering topics such as types of strain, strain units, normal strain calculations, and the orientation of norm
0 views • 7 slides


