Understanding 95% Confidence Intervals in Statistics
Confidence intervals are a key concept in statistics that provide a range within which the true value of an estimate is likely to fall. This video series explores the interpretation of 95% CIs, compares them to standard error and standard deviation, and explains how sample size and standard deviation impact the width of the confidence intervals.
Download Presentation

Please find below an Image/Link to download the presentation.
The content on the website is provided AS IS for your information and personal use only. It may not be sold, licensed, or shared on other websites without obtaining consent from the author. Download presentation by click this link. If you encounter any issues during the download, it is possible that the publisher has removed the file from their server.
E N D
Presentation Transcript
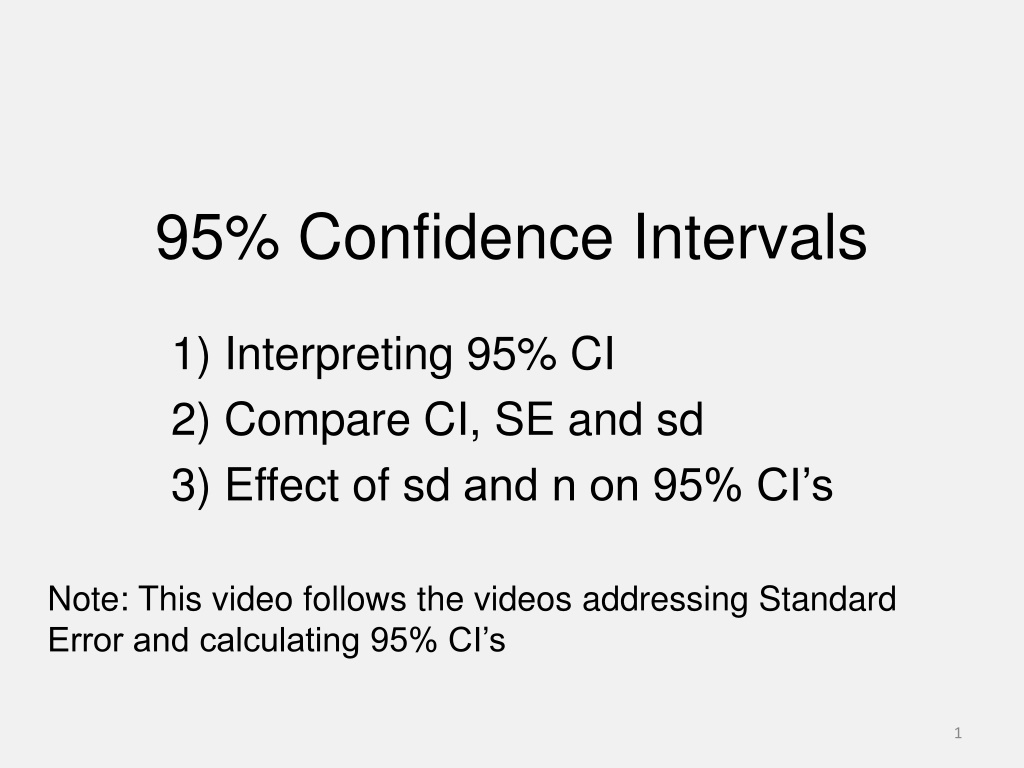
95% Confidence Intervals 1) Interpreting 95% CI 2) Compare CI, SE and sd 3) Effect of sd and n on 95% CI s Note: This video follows the videos addressing Standard Error and calculating 95% CI s 1
What is a 95% Confidence Interval? If we repeated our experiment many times and calculated a 95% CI each time, the 95% CI s would include the true value (assuming assumptions are met) 95% of the time. 2
What is a 95% Confidence Interval? If we repeated our experiment many times and calculated a 95% CI each time, the 95% CI s would include the true value (assuming assumptions are met) 95% of the time. 3
What is a 95% Confidence Interval? Review: compare standard deviation, SE, 95% CI s: A less technical view: 95% CI s provide a plausible range for the true value we aim to estimate. 8 6 4 2 sd and n affect SE and CI similarly. 0 sd CI SE 4
