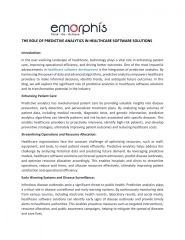
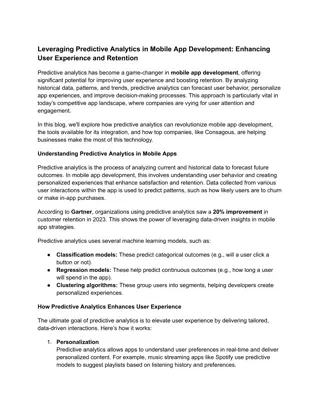
THE ROLE OF PREDICTIVE ANALYTICS IN HEALTHCARE SOFTWARE SOLU
In the ever-evolving landscape of healthcare, technology plays a vital role in enhancing patient care, improving operational efficiency, and driving better outcomes. One of the most impactful advancements in healthcare software development is the integration of predictive analytics.
3 views • 3 slides
Understanding Data Visualization with Matplotlib in Python
Matplotlib is a powerful Python package for data visualization, offering both an integrated interface (pyplot) and a native object-oriented interface. This tool enables users to create various types of plots and gives control over the visualization process. Learn about basic operations, differences
6 views • 19 slides
Predictive DFT Mixing: Successes and Opportunities in Materials Science
Laurie Marks from Northwestern University discusses the successes and opportunities in predictive DFT mixing, focusing on the advancements in density functional theory, fixed-point solvers, and the approach taken in physics and pragmatism. The presentation includes insights on the applications of DF
2 views • 52 slides
Harnessing AI for Smarter Predictive Pricing in Cargo Services
In today's fast-paced global market, the efficiency and agility of cargo services are paramount. One of the significant challenges faced by the logistics sector involves the dynamic nature of pricing strategies which directly influence profitability and customer satisfaction. Here, Artificial Intell
10 views • 5 slides
Revolutionizing Field Force Management with Advanced Applications
Revolutionizing field force management, advanced applications leverage AI, IoT, and predictive analytics to optimize resource allocation, enhance decision-making, and boost productivity. Predictive analytics forecasts demand, streamlines maintenance, and optimizes routes, ensuring efficiency and cus
13 views • 6 slides
Open Source Chat Based Data Visualization With Helical Insight
Open Source Chat Based Data Visualization plays a pivotal role in modern business operations, enabling organizations to derive insights, make informed decisions, and drive growth. However, traditional visualization tools often come with high costs and steep learning curves, limiting accessibility an
1 views • 2 slides
Benefits of Open Source Chat-based Data Visualization
In the realm of Business Intelligence (BI), data visualization plays a pivotal role in transforming raw data into actionable insights. Traditional BI tools often require users to possess technical expertise in querying databases and creating visualizations. However, the emergence of open source chat
1 views • 2 slides
Software Development Analytics Tool Market Share, Forecasts 2023-2030
The Software Development Analytics Tool market's significance extends beyond mere project monitoring; it delves into the realm of predictive analytics. By leveraging historical data and performance metrics, these tools enable organizations to anticipate potential bottlenecks, identify areas for impr
0 views • 8 slides
Software Development Analytics Tool Market Share, Forecasts 2023-2030
\nThe Software Development Analytics Tool market's significance extends beyond mere project monitoring; it delves into the realm of predictive analytics. By leveraging historical data and performance metrics, these tools enable organizations to anticipate potential bottlenecks, identify areas for im
0 views • 8 slides
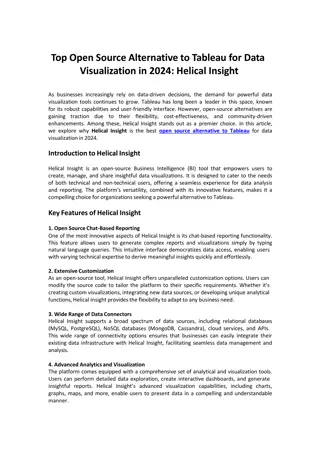
Open Source Alternative to Tableau for Data Visualization in 2024
As businesses increasingly rely on data-driven decisions, the demand for powerful data visualization tools continues to grow. Tableau has long been a leader in this space, known for its robust capabilities and user-friendly interface. However, open-source alternatives are gaining traction due to the
0 views • 2 slides
Reusing Phylogenetic Data for Enhanced Visualization and Analysis
Reusing phylogenetic data can revolutionize scientific research by enabling synthesis of knowledge and comparative analyses across scientific disciplines. However, a significant portion of valuable phylogenetic data is lost due to the prevalent use of static images for tree publication. To address t
0 views • 8 slides
Future-Proof Your Career DevOps Certifications for Predictive Analytics
As businesses continue to embrace digital transformation, the demand for professionals who can integrate DevOps with predictive analytics will only grow. By obtaining relevant certifications, you can position yourself at the forefront of this excitin
0 views • 8 slides
Understanding Wind Tunnels: Devices for Aerodynamic Testing
Wind tunnels are devices that simulate air flows to test models under controlled conditions. They are classified as low-speed and high-speed tunnels, used to replicate flying or moving objects. Testing involves studying air motion using techniques like smoke visualization, colored threads, and speci
2 views • 37 slides
Reading Activities and Predictive Learning Session Details
Engage in reading activities and predictive learning exercises. Access resources and participate in daily readings. Develop skills such as prediction, inference, vocabulary understanding, and summarizing. Explore thrilling reads and enhance your reading comprehension. Join the session on May 6th, 20
0 views • 7 slides
BricknBolt: AI-Powered Predictive Maintenance for Construction Equipment
The most significant thing in the modern construction industry is how efficient and reliable the equipment is. It is very costly to experience downtime since it results in increased costs and delays. Predictive maintenance, aided by Artificial Intell
1 views • 5 slides
Interactive Plotting with ggplot and Shiny: Enhancing Galaxy Visualization Tools
Explore the concept of transforming existing ggplot2 Galaxy tools into interactive platforms using Shiny or Plotly implementations. Discover a variety of plot types available with ggplot2, such as barplots, violin plots, PCA plots, and heatmaps. Utilize additional plot options through various geom_*
1 views • 9 slides
Understanding Non-Parametric ROC Analysis in Diagnostic Testing
Non-parametric ROC analysis is a crucial method in diagnostic testing to determine the performance of binary classification tests in distinguishing between diseased and healthy subjects. This analysis involves evaluating sensitivity, specificity, positive predictive value, and negative predictive va
10 views • 22 slides
EEG Conformer: Convolutional Transformer for EEG Decoding and Visualization
This study introduces the EEG Conformer, a Convolutional Transformer model designed for EEG decoding and visualization. The research presents a cutting-edge approach in neural systems and rehabilitation engineering, offering advancements in EEG analysis techniques. By combining convolutional neural
1 views • 6 slides
Predictive Performance of CSF A1-42 and Tau on Cognitive Decline and Dementia Progression
Analysis conducted at the Perelman School of Medicine, University of Pennsylvania, evaluated the predictive performance of cerebrospinal fluid markers A1-42, t-tau, and p-tau181 on cognitive decline and progression to dementia. The study included 2401 ADNI1/GO/2 CSF samples from individuals across d
0 views • 19 slides
Advanced Imputation Methods for Missing Prices in PPI Survey
Explore the innovative techniques for handling missing prices in the Producer Price Index (PPI) survey conducted by the U.S. Bureau of Labor Statistics. The article delves into different imputation methods such as Cell Mean Imputation, Random Forest, Amelia, MICE Predictive Mean Matching, MI Predict
0 views • 22 slides
Leveraging Predictive Analytics in Mobile App Development_ Enhancing User Experience and Retention
Discover how predictive analytics is transforming the mobile app development landscape in our latest blog, How Predictive Analytics is Shaping the Future of Mobile App Development. By leveraging data and machine learning models, predictive analytics
0 views • 4 slides
Design and Evaluation in Visualization Techniques
Understanding the importance of formal evaluations in visualization techniques, this material covers a range of evaluation methods including empirical and analytic approaches such as usability tests, controlled experiments, and expert reviews. It delves into the scientific method of hypothesis forma
1 views • 41 slides
Addressing Sustainability Challenges in Agriculture Through Predictive Phenomics at ISU's Plant Science Institute
ISU's Plant Science Institute is tackling sustainability challenges in agriculture by using predictive models based on genotypic, phenotypic, and environmental data. Through collaborations and investments in scholars, the institute aims to enhance plant breeding programs, improve crop resilience to
0 views • 8 slides
Understanding Similarity and Cluster Analysis in Business Intelligence and Analytics
Explore the concept of similarity and distance in data analysis, major clustering techniques, and algorithms. Learn how similarity is essential in decision-making methods and predictive modeling, such as using nearest neighbors for classification and regression. Discover (dis)similarity functions, n
0 views • 35 slides
Multidimensional Icons in Data Visualization Solutions
This collection showcases various types of visual icons used in data visualization to represent values of different variables, such as categorical, quantitative, and Boolean data. Each icon summarizes specific information for a given item in a collection, ranging from nominal and ordinal data to the
0 views • 9 slides
Utilizing Surveys and Feedback Data for Predictive Analytics
Discover how surveys and customer feedback play a crucial role in strategic Predictive Analytics applications. Learn about the importance of data collection, analysis tools, and the growth factors driving the demand for feedback data. Gain insights into the benefits of leveraging feedback data for e
0 views • 16 slides
Analyzing NFL Matchups: Predictive Models and Insights
Exploring predictive models for NFL game outcomes based on weather conditions, home/away advantage, and gambling spread effects. Utilizing logistic regression, decision tree, and neural network models to predict winners. Key variables include schedule date, season, team scores, stadium details, and
0 views • 9 slides
Enhancing Safety in Navigation Through Improved Data Quality Visualization
The IHO Data Quality Working Group focuses on classifying and depicting the quality of digital hydrographic information to ensure safe navigation. The group addresses the need for clear warnings on ECDIS displays regarding poor-quality survey data. Despite progress in developing visualization method
0 views • 34 slides
Software Design Patterns for Information Visualization
Explore design patterns for information visualization interfaces, understand the complexities, and leverage tools like Google API. Learn about different software design patterns, categories of patterns for information visualization, and the relationships between them. Discover the reference model fo
0 views • 27 slides
Predictive Model for Coach Firings in NCAA Division I Men's Basketball
This presentation discusses a predictive model for coach firings in NCAA Division I Men's Basketball based on data from Power 5 conferences. The study analyzes variables such as winning percentage, years coaching, tournament appearances, and turnover rate to predict coach firings. Logistic regressio
0 views • 9 slides
Interactive Data Visualization Tools and Techniques Quiz
This quiz tests knowledge on data visualization tools, techniques, and concepts. Questions cover topics such as the use of EDA in data visualization, interactive graph outputs, historical figures in data visualization, GIS data types in SAS/JMP, outlier detection in 3D scatterplots, and limitations
0 views • 11 slides
Cognition Models in InfoVis: Understanding Knowledge Creation Process
Visualization plays a key role in aiding cognition by supporting knowledge creation and seeking tasks through process models and task taxonomies. Understanding the cognitive aspects of information visualization is crucial for aiding comprehension and knowledge understanding, as demonstrated by the u
0 views • 41 slides
Evaluation of Fairness Trade-offs in Predicting Student Success
This study delves into fairness concerns in predicting student success, examining trade-offs between different measures of fairness in course success prediction models. It explores statistical fairness measures like demographic parity, equality of opportunity, and positive predictive parity. Through
0 views • 11 slides
Understanding High-Value Diagnostic Testing and Cancer Screening
Review key biostatistical concepts including sensitivity, specificity, positive predictive value, and negative predictive value to make informed decisions in high-value care. Learn how to customize screening recommendations based on individual risk factors and values, considering benefits, harms, an
0 views • 26 slides
Enhancing Classmate's Data Visualization for Homework Assignment 2
Explore the process of applying a classmate's data visualization code to your own data for Homework Assignment 2. Critique the effectiveness of the visualization in conveying the intended point and offer suggestions for improvement if necessary. Follow the steps outlined to submit your completed ass
0 views • 4 slides
Analysis and Predictive Modeling of Ancient Greek Temples Throughout the Mediterranean
This study by Sean Patrick Yusko delves into the analysis and predictive modeling of ancient Greek temples in the Mediterranean region. It focuses on spatial relationships, patterns, and potential predictive modeling based on data collected from 236 temples spanning from 800 BC to 150 AD. The resear
0 views • 13 slides
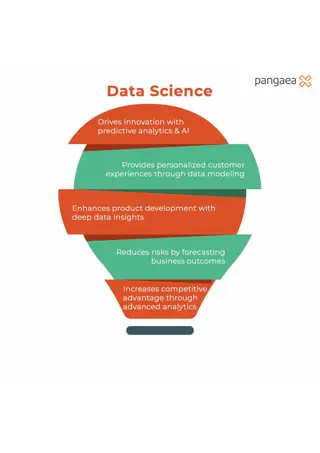
The Power of Data Science: Transforming Business with Predictive Analytics
Explore how data science, predictive analytics, and AI drive business success by enhancing customer experiences, product development, and risk reduction. Unlock competitive advantages with data-driven insights. Discover how Pangaea X can help you dri
2 views • 1 slides
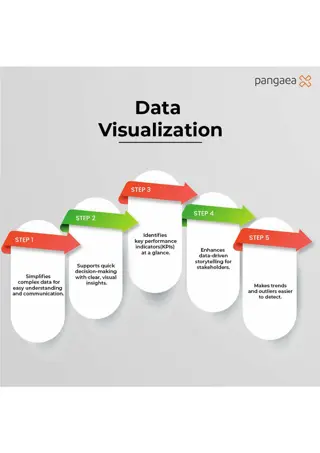
Maximize Business Impact with Data Visualization
This infographic shows how data visualization simplifies complex data, supports decision-making, highlights KPIs, and enhances data-driven storytelling. Its an essential tool for identifying trends and outliers. Discover expert data visualization talent at Pangaea X by visiting www.pangaeax.com.
6 views • 1 slides
Data Visualization Presentations Collection
Collection of various image slides containing charts, graphs, and data visualization elements. The slides showcase different types of visual representations such as bar graphs, line charts, percentages, and more. Each slide provides a unique visualization, making it a diverse collection for presenta
0 views • 13 slides
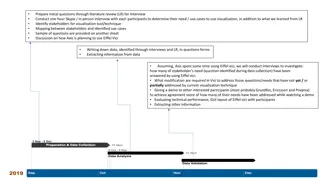
Effective Stakeholder Interviews for Visualization Tool Improvement
Conducting in-depth interviews with stakeholders is crucial for identifying their needs and use cases for visualization tools. By asking targeted questions and analyzing responses, insights can be gained to enhance the current visualization technique, like Eiffel Vici. The process involves mapping s
0 views • 5 slides
