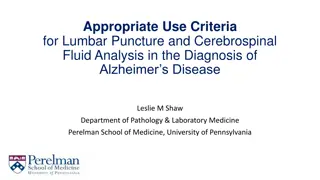
Predictive Performance of CSF A1-42 and Tau on Cognitive Decline and Dementia Progression
Analysis conducted at the Perelman School of Medicine, University of Pennsylvania, evaluated the predictive performance of cerebrospinal fluid markers A1-42, t-tau, and p-tau181 on cognitive decline and progression to dementia. The study included 2401 ADNI1/GO/2 CSF samples from individuals across different cognitive states. Results indicated differences in marker levels among different groups and their potential utility in predicting cognitive decline. Notably, the study explored the impact of these markers on clinical outcomes and their association with amyloid-PET findings.

Download Presentation

Please find below an Image/Link to download the presentation.
The content on the website is provided AS IS for your information and personal use only. It may not be sold, licensed, or shared on other websites without obtaining consent from the author.If you encounter any issues during the download, it is possible that the publisher has removed the file from their server.
You are allowed to download the files provided on this website for personal or commercial use, subject to the condition that they are used lawfully. All files are the property of their respective owners.
The content on the website is provided AS IS for your information and personal use only. It may not be sold, licensed, or shared on other websites without obtaining consent from the author.
E N D
Presentation Transcript
Predictive Performance of CSF A 1-42and Tau for Cognitive Decline and Progression to Dementia Leslie M Shaw Perelman School of Medicine University of Pennsylvania
Analysis of 2401 ADNI1/GO/2 CSF samples 2401 (1221 BASELINE + 1180 longitudinal) ADNI pristine CSFs, collected from 9/7/2005 to 7/25/2016 were analyzed in 36 analytical runs at UPenn from 11-17-2016 to 1-20-2017: ADNI Phase HC SMC EMCI LMCI AD 1221 BASELINE ADNI CSFs ADNI 1 112 -- -- 192 98 ADNIGO/2 160 96 277 154 132
Analyses of ADNI1/GO/2 CSF A1-42, t-tau, p-tau181using the Roche Elecsys fully automated immunoassay platform At our previous ADNI meeting the following were described. Rationale for moving from RUO to full automation Validation of A 1-42 for precision, accuracy, and clinical performance General statistics for A 1-42, t-tau, p-tau181, t-tau/A 1-42, p-tau181/A 1-42in the ADNI1/GO/2 CSF samples Histogram distributions for A 1-42, t-tau/A 1-42, p-tau181 Distributions based on FBP amyloid- PET + or Cutpoint determinations Collaborative study with BioFINDER Concordance with FBP amyloid- PET Prediction of cognitive decline(CDRsob) Assessments of the contribution of CSF t-tau and p-tau181to the clinical utility of CSF A 1-42
ADNI1 BASELINE CSF A1-42, t-tau, p-tau181& ratios A 1-42 (pg/mL) t-tau/A 1-42 p-tau181/A 1-42 % 4+ ADNI1 t-tau p-tau181 (pg/mL) (pg/mL) 70.4 AD Median 558 349 34 0.61 0.063 N=98 mean SD 659 375 359 130 36 15 0.64 0.29 0.065 0.033 95% CI 306-1663 154-687 13-73 0.15-1.40 0.012-0.14 54.1 MCI 658 294 28 0.48 0.048 Median 846 482 312 124 31 14 0.51 0.30 0.049 0.033 N=192 mean SD 293-2041 140-599 12-63 0.12-1.13 0.010-0.13 95% CI 24.1 NC 1239 218 20 0.18 0.015 Median 1246 647 239 84 22 9 0.27 0.18 0.023 0.018 N=111 mean SD 401-2742 112-444 11-43 0.11-0.73 0.0089-0.075 95% CI
ADNIGO/2 CSF BASELINE A1-42, t-tau, p-tau181 & ratios ADNIGO/2 A 1-42 t-tau p-tau181 t-tau/A 1-42 p-tau181/A 1-42 % 4+ (pg/mL) (pg/mL) (pg/mL) AD Median 66.7 594 334 33 0.57 0.058 649 257 375 155 37 16 0.62 0.33 0.062 0.034 N=132 mean SD 309-1375 170-750 15-76 0.14-1.41 0.012-0.15 95% CI Median 57.1 793 286 28 0.39 0.037 LMCI 936 494 308 136 30 15 0.41 0.25 0.041 0.023 N=154 mean SD 342-2275 115-577 10-63 0.1-0.98 0.0078-0.099 95% CI Median 42.2 1052 234 20 0.20 0.017 EMCI 1178 588 256 122 24 14 0.29 0.25 0.028 0.028 N=277 mean SD 395-2431 117-582 10-67 0.09-0.94 0.0077-0.103 95% CI Median 34.4 SMC 1324 218 19 0.15 0.013 1364 612 241 94 22 10 0.22 0.15 0.020 0.015 N=96 mean SD 466-2691 107-462 10-49 0.09-0.62 0.0081-0.0653 95% CI 26.9 Median 1285 211 19 0.15 0.013 NC 1384 667 238 92 22 9 0.22 0.16 0.021-0.028 N=160 mean SD 421-2697 110-469 10-48 0.09-0.68 0.0076-0.0698 95% CI
A1-42 all values 1239 1324 1052 1285 793* 658 594 558 Numbers inside the boxes are the respective median values for BL A 1-42 in pg/mL placed above the median value horizontal line. *p<0.005 for LMCI ADNIGO+2 vs ADNI1; p=0.11 for NL ADNIGO+2 vs ADNI1; p=0.23 for AD ADNIGO+2 vs ADNI1
t-tau 349 334 294 286 234 218 218 211 Numbers inside the boxes are the respective median values for BL t-tau in pg/mL placed above the median value horizontal line. P=0.81 for NL ADNIGO+2 vs ADNI1; p=0.51 for MCI ADNIGO+2 vs ADNI1; p=0.81 for AD ADNIGO+2 vs ADNI1
p-tau181 34.0 33.2 28.4 27.6 20.0 19.9 19.3 19.3 Numbers inside the boxes are the respective median values for p-tau181 in pg/mL placed above the median value horizontal line. *p=0.71 for ADNIGO+2 vs ADNI1; p=0.43 for MCI ADNIGO+2 vs ADNI1; p=0.88 for AD ADNIGO+2 vs ADNI1.
ROC Curves for SMC+EMCI+LMCI+AD CSF biomarkers using FBP PET+/- as the clinical endpoint In the ADNI study* AUC values: p-tau/A 1-42 0.944 91.3% 88.5% 90.2% t-tau/A 1-42 0.940 91.6% 87.4% 89.9% A 1-42 0.889 86.7% 81.7% 84.6% p-tau181 0.845 79.9% 74.8% 77.8% t-tau 0.803 74.0% 72.9% 73.5% Sens Spec Eff Cutpoint values: p-tau/A 1-42 t-tau/A 1-42 A 1-42 p-tau181 t-tau 0.021 0.222 980 pg/mL 21.8 pg/mL 245 pg/mL 2017 ADNI dataset included in the collaboration with the Swedish BioFINDER study *SUVR of 1.1 used: Landau and Jagust
Frequency distribution plots: upper are mixture model plots, lower are FBP+ and FBP- for ADNI SMC/EMCI/LMCI/AD ptau181/A 1-42 tau/A 1-42 A 1-42
Frequency distribution plots: upper simple frequency plots, lower are FBP+ and FBP- for ADNI SMC/EMCI/LMCI/AD aaaaaaaaaaaaaaaaaaaaaaaaaaaaaaaaaaaaaaaaaaaaaaaaaaaaaaaaaaaaaaaaaaa tau p-tau181 FBP- FBP+ FBP- FBP+
Analyses of ADNI1/GO/2 CSF A1-42, t-tau, p-tau181 using the Roche Elecsys fully automated immunoassay platform In order to further address the question of what do CSF t-tau and p-tau181 add to the clinical utilities of CSF A 1 42we describe the following analyses for the ADNIGO/2 EMCI+MCI participants: Stratify into 4 sub-groups using A 42 and either t-tau or p-tau181 Amyloid plaque burden +/- represented by A 42+ or : [A + or A -] Tau pathology +/- represented by t-tau+ or - : [tau+ or tau-] or by p-tau181+ or - : [p-tau+ or p-tau-] Use the cut-points described in the previous ppt to determine + or for each biomarker. Test the hypothesis that having both A + & tau+ [ie, A +/tau+ or A +/p-tau+] is associated with much greater rates of cognitive, functional and memory decline as compared to having only one of the two pathologic states [ie, A +/tau- or A /tau+]. Test the hypothesis that the least cognitive decline is associated with both classes of CSF biomarker being negative. Test this also for risk for progression from a diagnosis of MCI to a diagnosis of AD dementia.
Rates of clinical decline as a function of A42 and t-tau in ADNIGO/2 EMCI+LMCI CDRsob FAQ A +/tau+ A +/tau+ A +/tau+ MMSE CDRsob FAQ MMSE Compare to A -/tau- 2yrs Compare to A -/tau- 2yrs Compare to A -/tau- 2yrs N 2 yr change N 2 yr change N 2 yr change A -/tau- A -/tau+ A +/tau- A +/tau+ A -/tau- A -/tau+ A +/tau- A +/tau+ A -/tau- A -/tau+ A +/tau- A +/tau+ 124 -0.022 -- 124 0.664 -- 124 -0.130 -- 42 0.048 0.070 42 0.406 -0.158 42 -0.404 -0.274 76 0.428 0.450 76 1.422 0.758 76 -0.784 -0.654 112 1.606 1.628 112 4.052 3.388 112 -2.410 -2.280
Rates of clinical decline as a function of A42 and p-tau181 in ADNIGO/2 EMCI+LMCI CDRsob FAQ A +/p-tau+ A +/p-tau+ A +/p-tau+ MMSE FAQ MMSE CDRsob Compare to A -/ptau- 2yrs Compare to A -/ptau- 2yrs 2 yr change Compare to A -/ptau- 2yrs N 2 yr change N 2 yr change N A -/ptau- A -/ptau+ A +/ptau- A +/ptau+ A -/ptau- A -/ptau+ A +/ptau- A +/ptau+ A -/ptau- A -/ptau+ A +/ptau- A +/ptau+ 124 0.654 -- 124 -0.136 -- 124 0.036 -- 42 0.534 -0.120 42 -0.312 -0.176 42 -0.116 -0.080 76 1.366 0.712 76 -0.804 -0.668 76 0.358 0.322 112 112 3.890 3.236 -2.280 -2.144 112 1.552 1.516
Characteristics of ADNIGO/2 E+LMCI for the study of A 42/p-tau181 combinations A 42-/p-tau181- A 42-/p-tau181+ 139 60 A 42+/p-tau181- A 42+/p-tau181+ N 87 145 APOE 4, N(%) 30(22%) 21(35%) 45(52%) 109(75%) Education, yrs A 42, pg/mL p-tau181, pg/mL t-tau, pg/mL tau/A 42 p-tau/A 42 # progressors 16.3 2.6 16.2 2.4 16.1 2.7 16.2 2.7 1557 413 1612 618 689 176 672 159 16.4 3.8 33.1 13.3 16.4 4.4 39.1 13.8 191 44 350 111 178 43 382 124 0.13 0.03 0.25 0.14 0.28 0.12 0.60 0.25 0.011 0.0028 0.024 0.016 0.026 0.012 0.061 0.028 5 5 11 56 # non-progressors 114 48 59 68 Drop-outs 20 7 17 21
Characteristics of ADNIGO/2 E+LMCI for the study of A 42/t-tau combinations A 42-/t-tau- A 42-/t-tau+ A 42+/t-tau- A 42+/t-tau+ N 154 45 116 116 APOE 4, N(%) 34(22%) 17(38%) 64(55%) 90(78%) Education, yrs A 42, pg/mL p-tau181, pg/mL t-tau, pg/mL tau/A 42 p-tau/A 42 Progressors 16.2 2.6 16.3 2.4 16.2 2.8 16.1 2.7 1578 433 1559 631 666 173 692 157 17.2 4.4 36.9 14.3 18.8 5.7 42.4 13.5 198 48 378 115 197 51 414 119 0.13 0.04 0.28 0.14 0.33 0.14 0.64 0.26 0.011 0.0034 0.027 0.017 0.031 0.015 0.065 0.029 6 4 18 49 Non-progressors 127 35 74 53 Drop-outs 21 6 24 14
Cox proportional-hazards analyses: comparisons across CSF t-tau (+ or ) combined with A 42 (+ or -) Hazard ratios: A 42-/t-tau+ 1.68(0.627 -- 4.50) A 42+/t-tau- 2.80(1.17 -- 6.67) A 42+/t-tau+ 9.23(4.15 -- 20.5) Cox proportional hazards models adjusted for gender, age, education years and APOE 4 allele #.
Cox proportional-hazards analyses: comparisons across CSF p-tau181 (+ or ) combined with A 42 (+ or -) Hazard ratios: A 42-/p-tau+ 1.41(0.521 -- 3.79) A 42+/p-tau- 2.46(1.04 -- 5.84) A 42+/p-tau+ 7.85(3.67 -- 16.8) Cox proportional hazards models adjusted for gender, age, education years and APOE 4 allele #.
ACKNOWLEDGEMENTS Biomarker Research Lab Magdalena Korecka Michal Figurski Magdalena Brylska Teresa Waligorska Leona Fields Jacob Alexander Ju Hee Kang CNDR/ADRC John Trojanowski Virginia M-Y Lee Steve Arnold David Irwin Murray Grossman Jon Toledo Alice Chen-Plotkin William Hu Anne Fagan Hugo Vanderstichele Kaj Blennow Henrik Zetterberg Douglas Galasko Chris Clark* Manu Vandijck John Lawson Udo Eichenlaub Tobias Bittner The Roche team Robert Dean Holly Soares Adam Simon Eric Siemers Piotr Lewczuk William Potter Rand Jenkins Erin Chambers Supported by the NIH/NIA & families of our patients MJ Fox Fdn for PD research *Deceased ADNI investigators include: (complete listing available at www.loni.usc.edu\ADNI\ Collaboration\ADNI_Manuscript_Citations.pdf