Unveiling Julian Schwinger's Electromagnetic Calculation
Discover the groundbreaking calculation by physicist Julian Schwinger on the electron's anomalous magnetic moment. Gain insights into this pivotal contribution in physics research that impacts our understanding of the electron's behavior. This work sheds light on Schwinger's innovative approach and
1 views • 33 slides
Power System Fault Calculation and Protection Analysis
In this technical document, we delve into the calculation of fault current and fault apparent power in symmetrical three-phase short circuit scenarios within power systems. Through detailed equivalent circuit diagrams, reactance calculations, and per unit value derivations, the fault current and app
5 views • 15 slides
Maximum Price Calculation for Callable Bond with Annual Yield Requirement
A 20-year callable bond example is provided with a $1000 face value and 3% annual coupons, callable at different redemption values over specific years. The task is to determine the maximum price a buyer should pay to achieve a minimum annual yield of 5%. The calculation involves identifying the time
1 views • 33 slides
FSS Escrow Calculation and Regulatory Updates Summary
Comprehensive overview of the new escrow calculation workbook, regulatory updates, and changes to the Final Rule for FSS escrow calculation. Key topics include FSS terminology, calculation examples, and important points for locally generated housing funds. The Final Rule changes include uncapped esc
4 views • 9 slides
Electrical Conductor Ampacity Calculation Scenarios
Various scenarios are presented involving the calculation of allowable ampacity for different types of electrical conductors connected to circuit breakers with temperature limitations. The calculations consider factors like conductor material, size, temperature ratings, and ambient conditions to det
0 views • 140 slides
Mean, Median, and Mode in Data Analysis
Explore the concepts of mean, median, and mode in data analysis through engaging visuals and interactive exercises. Learn about the different types of averages, how to calculate them, and their significance in understanding datasets. Practice finding the mean of various sets of data and solve real-w
0 views • 10 slides
Analysis of Gender Pay Gap Reporting at Oxford Health NHS FT as of March 2019
The Gender Pay Gap report at Oxford Health NHS FT covers key aspects including mean and median gender pay gaps in hourly pay, bonus gaps, proportion of employees receiving bonuses, and proportion of males and females in each pay quartile. The report also highlights workforce gender distribution, Age
0 views • 17 slides
Measures of Central Tendency in Statistics
Measures of central tendency, such as mean, median, and mode, provide a way to find the average or central value in a statistical series. These measures help in simplifying data analysis and drawing meaningful conclusions. The arithmetic mean, median, and mode are commonly used to represent the over
1 views • 11 slides
Hypertension: Types, Pathogenesis, and Management
The article discusses the physiological basis, types, pathogenesis, and genetic predisposition of hypertension. It explains the revision of terminology related to blood pressure and the calculation of mean arterial pressure. Secondary hypertension, causes, and mean arterial pressure determination ar
0 views • 29 slides
Measures of Central Tendency in Statistics
Measures of central tendency, such as mean, median, and mode, play a crucial role in statistical analysis by describing the central position in a dataset. Mean represents the average, median is the middlemost value, while mode is the most frequent value. Learn about their significance, calculation m
2 views • 12 slides
Master Mean Calculation from Frequency Tables with Hegarty Maths
Enhance your statistical skills by learning how to calculate the mean from a frequency table in lessons 3 and 4. Follow along with the provided images, watch the instructional video, attempt practice questions, and assess your understanding with a quiz on Hegarty Maths.
2 views • 8 slides
Normal Distribution and Its Business Applications
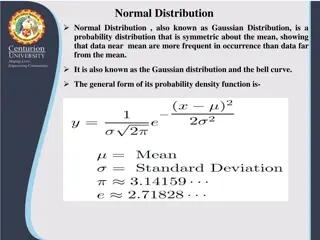
Normal distribution, also known as Gaussian distribution, is a symmetric probability distribution where data near the mean are more common. It is crucial in statistics as it fits various natural phenomena. This distribution is symmetric around the mean, with equal mean, median, and mode, and denser
2 views • 8 slides
Dealing with Range Anxiety in Mean Estimation
Dealing with range anxiety in mean estimation involves exploring methods to improve accuracy when estimating the mean value of a random variable based on sampled data. Various techniques such as quantile truncation, quantile estimation, and reducing dynamic range are discussed. The goal is to reduce
2 views • 12 slides
FTES Calculation in California Community Colleges
California Community Colleges use Full-Time Equivalent Students (FTES) to allocate apportionment revenue based on student attendance. FTES calculation involves factors like clock hours, class hours, passing time/breaks, and multiple-hour classes. Understanding these components is essential for educa
2 views • 35 slides
Measures of Variability: Variance and Standard Deviation
This lesson covers the concepts of variance and standard deviation as measures of variability in a data set. It explains how deviations from the mean are used to calculate variance, and how standard deviation, as the square root of variance, measures the average distance from the mean. Degree of fre
3 views • 26 slides
Analysis of Change in EAL Calculation Scenarios
In this analysis, Sanchir Dashnyam, the ERCOT Market Credit Manager, discusses the change in the EAL calculation formula, exploring different scenarios and their impacts on ERCOT markets. The scenarios involve adjustments to the application of RFAF against various parameters, aiming to optimize the
0 views • 7 slides
The Normal Probability Curve
The Normal Probability Curve, also known as the normal distribution, is a fundamental concept in statistics. It is symmetric around the mean, with key characteristics such as equal numbers of cases above and below the mean, and the mean, median, and mode coinciding. The curve's height decreases grad
1 views • 10 slides
Descubra o poder do Mean Well em Meanwellbrasil.com.br. Qualidade e
Descubra o poder do Mean Well em Meanwellbrasil.com.br. Qualidade e confiabilidade aliadas a um atendimento excepcional ao cliente. Junte-se \u00e0 fam\u00edlia Mean Well hoje!
3 views • 1 slides
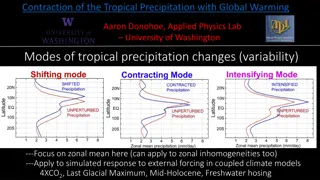
Contractions of Tropical Precipitation Under Global Warming
Aaron Donohoe's research focuses on the contraction of tropical precipitation with global warming, emphasizing the zonal mean and its implications for climate models. The results show a robust contraction and intensification of tropical precipitation in a warmer world. The width of tropical precipit
0 views • 12 slides
Advanced Imputation Methods for Missing Prices in PPI Survey
Explore the innovative techniques for handling missing prices in the Producer Price Index (PPI) survey conducted by the U.S. Bureau of Labor Statistics. The article delves into different imputation methods such as Cell Mean Imputation, Random Forest, Amelia, MICE Predictive Mean Matching, MI Predict
0 views • 22 slides
Back-End Ocean Data Analysis Program for LCS Calculation
A program designed to automatically retrieve ocean data over an eight-day period and compute Lagrangian Coherent Structures (LCS) on a daily basis. The generated data can then be plotted to visualize the LCS patterns in the ocean. Motivated by guiding fluid flows, the program can aid in predicting t
0 views • 11 slides
Functions of Random Variables and Sampling Distributions
This chapter delves into the functions of random variables and sampling distributions. It covers important statistics like populations, samples, and measures of central tendency such as the mean and median. Properties of these measures are discussed, along with examples illustrating their calculatio
0 views • 39 slides
Efficiency Enhancement in PHITS: Variance Reduction Techniques for Particle and Heavy Ion Transport
Explore techniques for improving calculation efficiency in the PHITS Multi-Purpose Particle and Heavy Ion Transport code system. Topics covered include neutron deep penetration calculation, effective dose calculation, and use of variance reduction techniques to enhance Monte Carlo simulation efficie
0 views • 24 slides
Overview of Calculation Tools for Mitigation Data Analysis Program under UNFCCC Secretariat
This content discusses various calculation tools used in the Mitigation Data Analysis program of the UNFCCC Secretariat. It includes tools for GHG projections, financial support, and their integration into Country briefs to facilitate accurate data presentation and reduce workload during reviews. De
0 views • 7 slides
Calculating Mean and Standard Deviation of Data Sets
Learn how to find the mean and standard deviation of a set of numbers using a calculator. Follow step-by-step instructions with accompanying images to understand the process. Additionally, an example is provided to calculate the mean and standard deviation of monthly salaries based on a frequency ta
2 views • 13 slides
Arithmetic Mean Calculation Methods
Arithmetic mean can be calculated in individual, discrete, and continuous series. In individual series, each item is listed separately, while in discrete and continuous series, items are grouped with frequencies. The mean can be computed using formulas tailored to each type of series, including meth
0 views • 4 slides
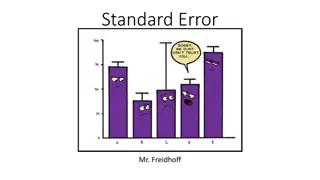
Uncertainty with Estimation and Standard Error
Explore the concept of estimating with uncertainty, focusing on calculating a mean and using standard error to describe the uncertainty in that mean. Delve into human height, a variable described by a normal distribution, to understand how samples may deviate from the true mean. Discover sampling er
0 views • 13 slides
Standard Error of the Mean in Statistics
Statistical measures like standard error of the mean (SEM) help assess how closely a sample average represents the true population mean. Smaller SEM indicates more significant data with large sample sizes and low variation, while larger SEM signifies less significant data with small sample sizes and
1 views • 8 slides
A Tutorial on Object Tracking using Mean Transform in Visual Applications
Introduction to object tracking in videos, discussing challenges such as scale, orientation, and location changes. Motivation behind target tracking in surveillance and virtual reality applications. Explanation of a method using sparse coding to modify mean-shift for handling changes in location, sc
0 views • 30 slides
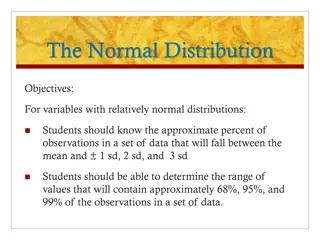
The Normal Distribution in Data Analysis
The normal distribution, also known as the bell-shaped or Gaussian distribution, is defined by the mean and standard deviation of quantitative data. It helps determine the range of values containing specific percentages of observations. Identifying frequency, probability, mean, and the relationship
0 views • 19 slides
Income Tax Calculation and Salary Calculation
This educational content covers various aspects of income tax calculation, including taxable rates, personal allowances, and calculations for different salary levels. It explains how to determine weekly, monthly, and annual salaries and provides examples of income tax calculations for different inco
0 views • 23 slides
Inflation and CPI Calculation
Learn about inflation and the Consumer Price Index (CPI) calculation process. Inflation is the rise in the overall price level in an economy, impacting the cost of living. CPI measures the cost of goods and services purchased by an average consumer to track changes in the cost of living over time. T
0 views • 39 slides
mean, median, and mode in statistics
In statistics, the mean represents the average value, the median is the middle value that divides a dataset into two halves, and the mode is the most frequent value. This guide explains how to calculate these statistical measures and provides examples. Additionally, it demonstrates how to estimate t
0 views • 11 slides
Measures of Central Tendency in Statistics
Measures of central tendency, such as mean, median, and mode, play a crucial role in statistics by indicating the central position of a data set. Mean is the average, while median is the middle value when data is arranged in order. These measures provide insights into data distribution, with mean ca
2 views • 12 slides
Random Slopes in Data Analysis
Exploring the impact of grand-mean and group-mean centering on intercept interpretation with random slopes, as well as variations in slope/intercept covariance. Differentiating between fixed and random coefficients, and the effects of adding group mean as a Level 2 variable. Delving into within vs.
0 views • 21 slides
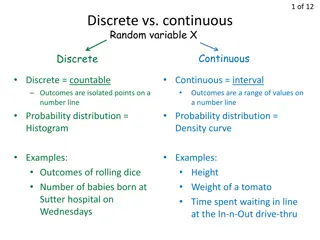
Random Variables and Mean in Statistics
Random variables can be discrete or continuous, with outcomes represented as isolated points or intervals. The Law of Large Numbers shows how the mean of observed values approaches the population mean as the number of trials increases. Calculating the mean of a random variable involves finding the e
0 views • 13 slides
Nrich Answers to Mode, Median, and Mean Questions by Joshua and Matthew
In this collection of math problems solved by Joshua and Matthew, explore different sets of positive numbers that satisfy conditions involving mode, median, and mean. Each question provides a detailed solution, offering insight into how to manipulate the numbers to meet the given criteria. From find
0 views • 8 slides
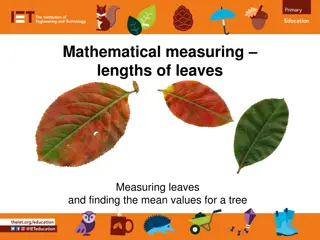
Measuring Lengths of Leaves and Finding Mean Values for a Tree
Collect and measure six leaves from the same tree to find the mean average length and width. Learn how to calculate mean values and label parts of a leaf.
0 views • 6 slides
Estimates of Mean and Errors in Gaussian Distribution
In Chapter 4, the method of least squares for estimating the mean in Gaussian distribution is discussed using the method of maximum likelihood. The concept is explained through equations detailing the probability function and calculation of the most probable value for the mean.
0 views • 9 slides
Estimates of Mean and Errors in Data Analysis
In Chapter 4, we delve into the method of least squares for estimating the mean in data analysis. Through maximum likelihood, we explore how to derive the most probable value for the mean from a set of observations. The relevance of Gaussian and Poisson distributions, along with the calculation of e
0 views • 24 slides


