Analyzing Qualitative and Quantitative Data
The findings from qualitative and quantitative data analysis. Learn how to apply analysis steps, compare platforms, and interpret results.
0 views • 33 slides
Understanding Cervical Screening Test Results
Guidance provides information on understanding the results of cervical screening tests, including primary HPV screening and the significance of positive and negative test results. It also explains the reasons for repeating a sample and the management recommendations based on the test results.
18 views • 16 slides
LATERAL FLOW LIPOARABINOMANNAN TESTING AND QUALITY ASSURANCE TRAINING MATERIALS
This training program provides comprehensive materials for conducting quality-assured Lateral Flow Lipoarabinomannan (LF-LAM) testing in the context of Tuberculosis (TB) and TB/HIV co-infection. The agenda covers essential aspects such as test procedures, quality improvement, and participant objecti
4 views • 51 slides
Understanding Ethnographic Research Design
Ethnography, a qualitative research method, involves studying people and cultures through observation and interaction in their natural environment. Researchers immerse themselves in the subject group to gain insights, interpret results through a cultural lens, and document findings through detailed
1 views • 21 slides
Applied Statistics in Psychology: Bridging Theory and Research
This course focuses on teaching applied statistics in psychology, with an emphasis on inferential statistics such as t-tests, ANOVA, correlation, regression, and chi-square. Real-world examples, diversity research, and connections to research methodology are highlighted throughout the course to enha
0 views • 23 slides
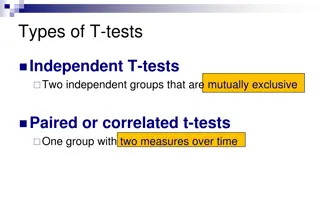
Understanding Different Types of T-Tests in Psychological Research
This article provides an overview of different types of t-tests used in psychological research, including independent t-tests for comparing two groups, paired or correlated t-tests for within-group comparisons, and the assumptions behind conducting these tests. It also includes examples of when to u
1 views • 7 slides
Understanding Spatial Analysis in GIS for Effective Decision-Making
Spatial analysis in GIS involves modeling geographic problems, processing data, and exploring results to understand spatial relationships, patterns, and suitability for various purposes. GIS tools offer unique capabilities for handling geographically referenced data, data entry, storage, manipulatio
2 views • 21 slides
Understanding Infrared Radiation in Energy Transfer Experiments
Explore the difference between conduction and convection, sources of infrared radiation, and how energy is transferred through radiation. Investigate how different surfaces emit varying levels of infrared radiation using a practical experiment with black and silver tins. Analyze and interpret result
0 views • 11 slides
Understanding Exam Results: A Comprehensive Guide for Students
This comprehensive guide covers how exam results are calculated, accessing your results online, understanding your result details, and interpreting progression categories. Learn about supplemental exams, appeals processes, and support resources available. Get insights on credit calculations, marks i
1 views • 21 slides
Hand Calculation of Odds Ratio Using JMP Results
Learn how to manually calculate odds ratios using JMP results. Follow step-by-step instructions to convert parameter estimates, derive odds ratios, and interpret results with confidence. Enhance your statistical analysis skills today!
0 views • 8 slides
Enhancing Innovation Through Horizon Results Platform
Facilitating the uptake of Key Exploitable Results (KERs) from research programs like FP7, Horizon 2020, and Horizon Europe, the Horizon Results Platform aims to translate scientific research into valuable innovations for the economy and society. Through a structured approach to identifying and prio
0 views • 8 slides
Mastering Financial Presentation with Charts
Learn how to effectively present financial results and analysis like a pro using various types of charts such as waterfall charts, stacked bar charts, and mekko charts. Understand how to interpret income statements, identify areas for improvement, compare trends over time, and showcase budget growth
1 views • 21 slides
Enhancing Research Impact Through Horizon Results Booster
Horizon Results Booster is a free-of-charge service provided by the European Commission aimed at maximizing the impact of research and innovation projects. It focuses on improving exploitation potential, implementing dissemination strategies, and increasing access to markets and policymakers. The se
0 views • 8 slides
Understanding Odds Ratio and Bias in Case-Control Studies
This educational material covers the essentials of odds ratio and bias in case-control studies, including how to construct a 2x2 table, calculate odds ratio, define bias, and interpret results. A specific case study on pesticide exposure and cancer is presented to illustrate these concepts. Readers
2 views • 20 slides
Enhancing Tournament Results Display on Chess-Results.com
Streamlining the display of tournament results on Chess-Results.com for optimal visibility and accessibility. Learn how to customize and improve the presentation of tournaments uploaded to the platform, including customizing lists, changing displayed fields, and exploring various customization optio
0 views • 15 slides
Understanding Microbiology Testing Methods and Results
Explore the various methods of microbiology testing, learn to interpret microbiological test results, and understand antibiotic susceptibility testing. Discover details on bacterial, viral, and parasitic infections through laboratory reports and supporting results like WBC counts and pathogen identi
0 views • 29 slides
Understanding Inference for Experiments in Statistics
Learn about inference for experiments in statistics, including completely randomized design, statistical significance, and random assignment to treatments. Discover how to analyze results, determine significance, and interpret differences in responses. Explore the concept through practical applicati
1 views • 10 slides
Enhancing Project Results with Horizon Results Booster Go-to-Market Support
The Horizon Results Booster Service offers comprehensive Go-to-Market support divided into six distinct types, including pitching, IPR support, innovation management training, business services, exploitation options, and access to non-EU funding. Eligibility requirements and package options are outl
0 views • 15 slides
Understanding the Triple Sugar Iron Test in Biochemical Analysis
The Triple Sugar Iron Test (TSI) is a crucial biochemical test used to differentiate gram-negative enteric bacilli based on their carbohydrate fermentation and hydrogen sulfide production. By examining color changes, gas production, and precipitate formation, microbiologists can interpret TSI result
2 views • 31 slides
Guidelines for Describing and Interpreting Tables and Figures in Academic Writing
Learn essential steps to effectively describe and interpret tables and figures in academic writing. Understand how to analyze data, interpret trends, and avoid biases. Gain insights into the anatomy of tables and figures, enabling clearer communication of research findings.
0 views • 18 slides
Power System Transient Stability Overview: ECEN 667 Lecture Summary
This summary covers the key points discussed in the lecture on transient stability in power systems by Professor Tom Overbye at Texas A&M University. Topics include contingency analysis, results interpretation, PowerWorld Simulator usage, plotting results, and more. Detailed information is provided
0 views • 43 slides
Achieving Comparable Results in Laboratory Practice
Good laboratory practice necessitates minimal error in measurement to reflect a patient's biological condition accurately, ensuring comparable and reliable results regardless of testing location or method. Standardization, harmonization, and traceability play crucial roles in achieving uniformity an
0 views • 29 slides
Understanding Hypothesis Testing: Examples and Interpretation
This content covers various examples of hypothesis testing scenarios, including car drivers' preferences for turning directions, the effectiveness of a new drug compared to a standard treatment, and the probability of seeds germinating in a greenhouse. It explains how to formulate null and alternati
0 views • 11 slides
Understanding Critical Appraisal in Medicine
Dive into the world of critical appraisal in medicine, covering topics such as format, statistics, types of data, p-values, confidence intervals, randomisation, blinding, and more. Learn how to dissect research papers, interpret results, and apply findings to clinical practice effectively.
4 views • 68 slides
Lead Dust Sampling Technician - Laboratory Selection and Interpretation
Learn how to select a laboratory for lead dust sampling, maintain chain of custody, review and interpret lab results. Understand the importance of selecting an EPA-recognized lab, asking relevant questions, and ensuring quality control in the field. Detailed guidance on submitting samples, reviewing
0 views • 13 slides
Necta Form Four Results View Your CSEE Results Online
Use matokeotz.com, a dependable and user-friendly portal, to check your Necta Form Four Results and revel in your academic triumph. Make sure you don't pass up this opportunity!\n\n\/\/matokeotz.com\/cat\/exam-results\/
5 views • 1 slides
Visualizing Categorical Data in Data Analysis
Explore methods for displaying and describing categorical data effectively, from frequency tables to bar and pie charts. Understand the importance of visual representation in drawing insights and making comparisons. Dive into examples using football team data and Titanic survivors. Learn to identify
1 views • 20 slides
Dermatological Case Presentation: Clinical Findings and Pathology Results
Detailed presentation materials for a dermatological case including case history, clinical skin examination findings, clinical photographs, histopathology results, and additional workup details. Emphasis on the importance of non-identifying information in presentations for discussion at the CDS Quar
0 views • 6 slides
Oregon Statewide Assessment System Student Educational Equity Development Survey (SEED Survey)
The SEED Survey is a student survey in Oregon aimed at understanding educational experiences, providing insights for local investments, and enhancing data interpretation. Administered for Grades 3-11, it helps gather feedback to support student outcomes and interpret test results effectively. With c
0 views • 20 slides
Exploring Two-Way Tables in Statistics
Delve into the world of two-way tables in statistics through an interactive introduction, warm-up exercises, and practical examples. Learn how to analyze data, calculate relative frequencies, and draw meaningful conclusions through visual representations. Discover the correlation between different v
0 views • 13 slides
Understanding Compound Growth and Decay Through Examples
Compound growth and decay, specifically compound interest, involve calculating interest on a changing total amount over time. This concept is illustrated through various examples and equations, showcasing how investments or values increase or decrease with each period. Learn how to solve problems re
0 views • 9 slides
Results Framework: Enhancing Government Efficiency through Results-oriented Approach
This online workshop on June 21, 2023, led by Steven Kadish, focuses on transcending politics and prioritizing effective implementation to achieve significant results in the public sector. The workshop emphasizes the importance of execution and implementation in government operations, advocating for
0 views • 35 slides
Guide to Validating Eligibility Codes on Synergy Provider Portal
Learn how to validate eligibility codes on the Synergy Provider Portal for different types of funding, access the eligibility checker, input parent information for instant results, and interpret the outcome on the portal. Ensure successful validation for working families and those receiving governme
0 views • 11 slides
Safe User Manual and Weekly Reports Overview
Safe User Manual provides details on how users can access weekly reports, login, and search for specific product information. Users receive weekly notification emails and can customize their search criteria. The manual also explains how to interpret search results and export data for further analysi
0 views • 11 slides
Simulation Results for LC-Optimized PHY Proposal in July 2019
The document presents simulation results for an LC-optimized PHY proposal for TGbb based on G.9991 PHY. It includes details on the simulation setup, frame detection results, header modulation, coding simulation results, payload modulation, and coding simulation results. The setup involved various re
0 views • 18 slides
Learning to Interpret Natural Language Navigation Instructions from Observation
This research focuses on developing a system that can interpret natural language navigation instructions by observing humans' actions in a virtual environment. The goal is to create virtual agents capable of understanding and following instructions in video games and educational software, all based
0 views • 51 slides
Recent Train Times: A Guide for Running Reports and Interrogating Train Information
Recent Train Times is a publicly available website that consolidates train running information for passenger services across England, Scotland, and Wales. This guide explains how to run basic searches, understand the results, and interrogate individual train running information. Users can access up
0 views • 4 slides
West-Hill Health PCN GP Patient Survey 2022 Results Analysis
The GP Patient Survey 2022 results for West-Hill Health Primary Care Network (PCN) provide insights into patients' satisfaction levels with various GP practices. The survey covers aspects such as ease of access, helpfulness, satisfaction, and availability of appointment choices. Results show varying
0 views • 27 slides
Diagnostic Workup Results for Patient X
The diagnostic workup for Patient X includes various imaging studies such as ECG, CXR, Head CT scan, CT Abdomen/Pelvis, and Repeat CXR. Laboratory results show abnormal CBC values, BMP findings, LFTs, and lactate levels with associated VBG results. Further evaluation is needed based on these results
0 views • 11 slides
Understanding Social Cognition and Schemas
Social cognition explores how people perceive and interpret social information, using automatic and controlled thinking processes. Schemas are mental structures that help us organize knowledge about the social world, affecting how we remember, interpret, and act upon information. The self-confirming
0 views • 23 slides


