Analyzing Qualitative and Quantitative Data
The findings from qualitative and quantitative data analysis. Learn how to apply analysis steps, compare platforms, and interpret results.
Download Presentation

Please find below an Image/Link to download the presentation.
The content on the website is provided AS IS for your information and personal use only. It may not be sold, licensed, or shared on other websites without obtaining consent from the author.If you encounter any issues during the download, it is possible that the publisher has removed the file from their server.
You are allowed to download the files provided on this website for personal or commercial use, subject to the condition that they are used lawfully. All files are the property of their respective owners.
The content on the website is provided AS IS for your information and personal use only. It may not be sold, licensed, or shared on other websites without obtaining consent from the author.
E N D
Presentation Transcript
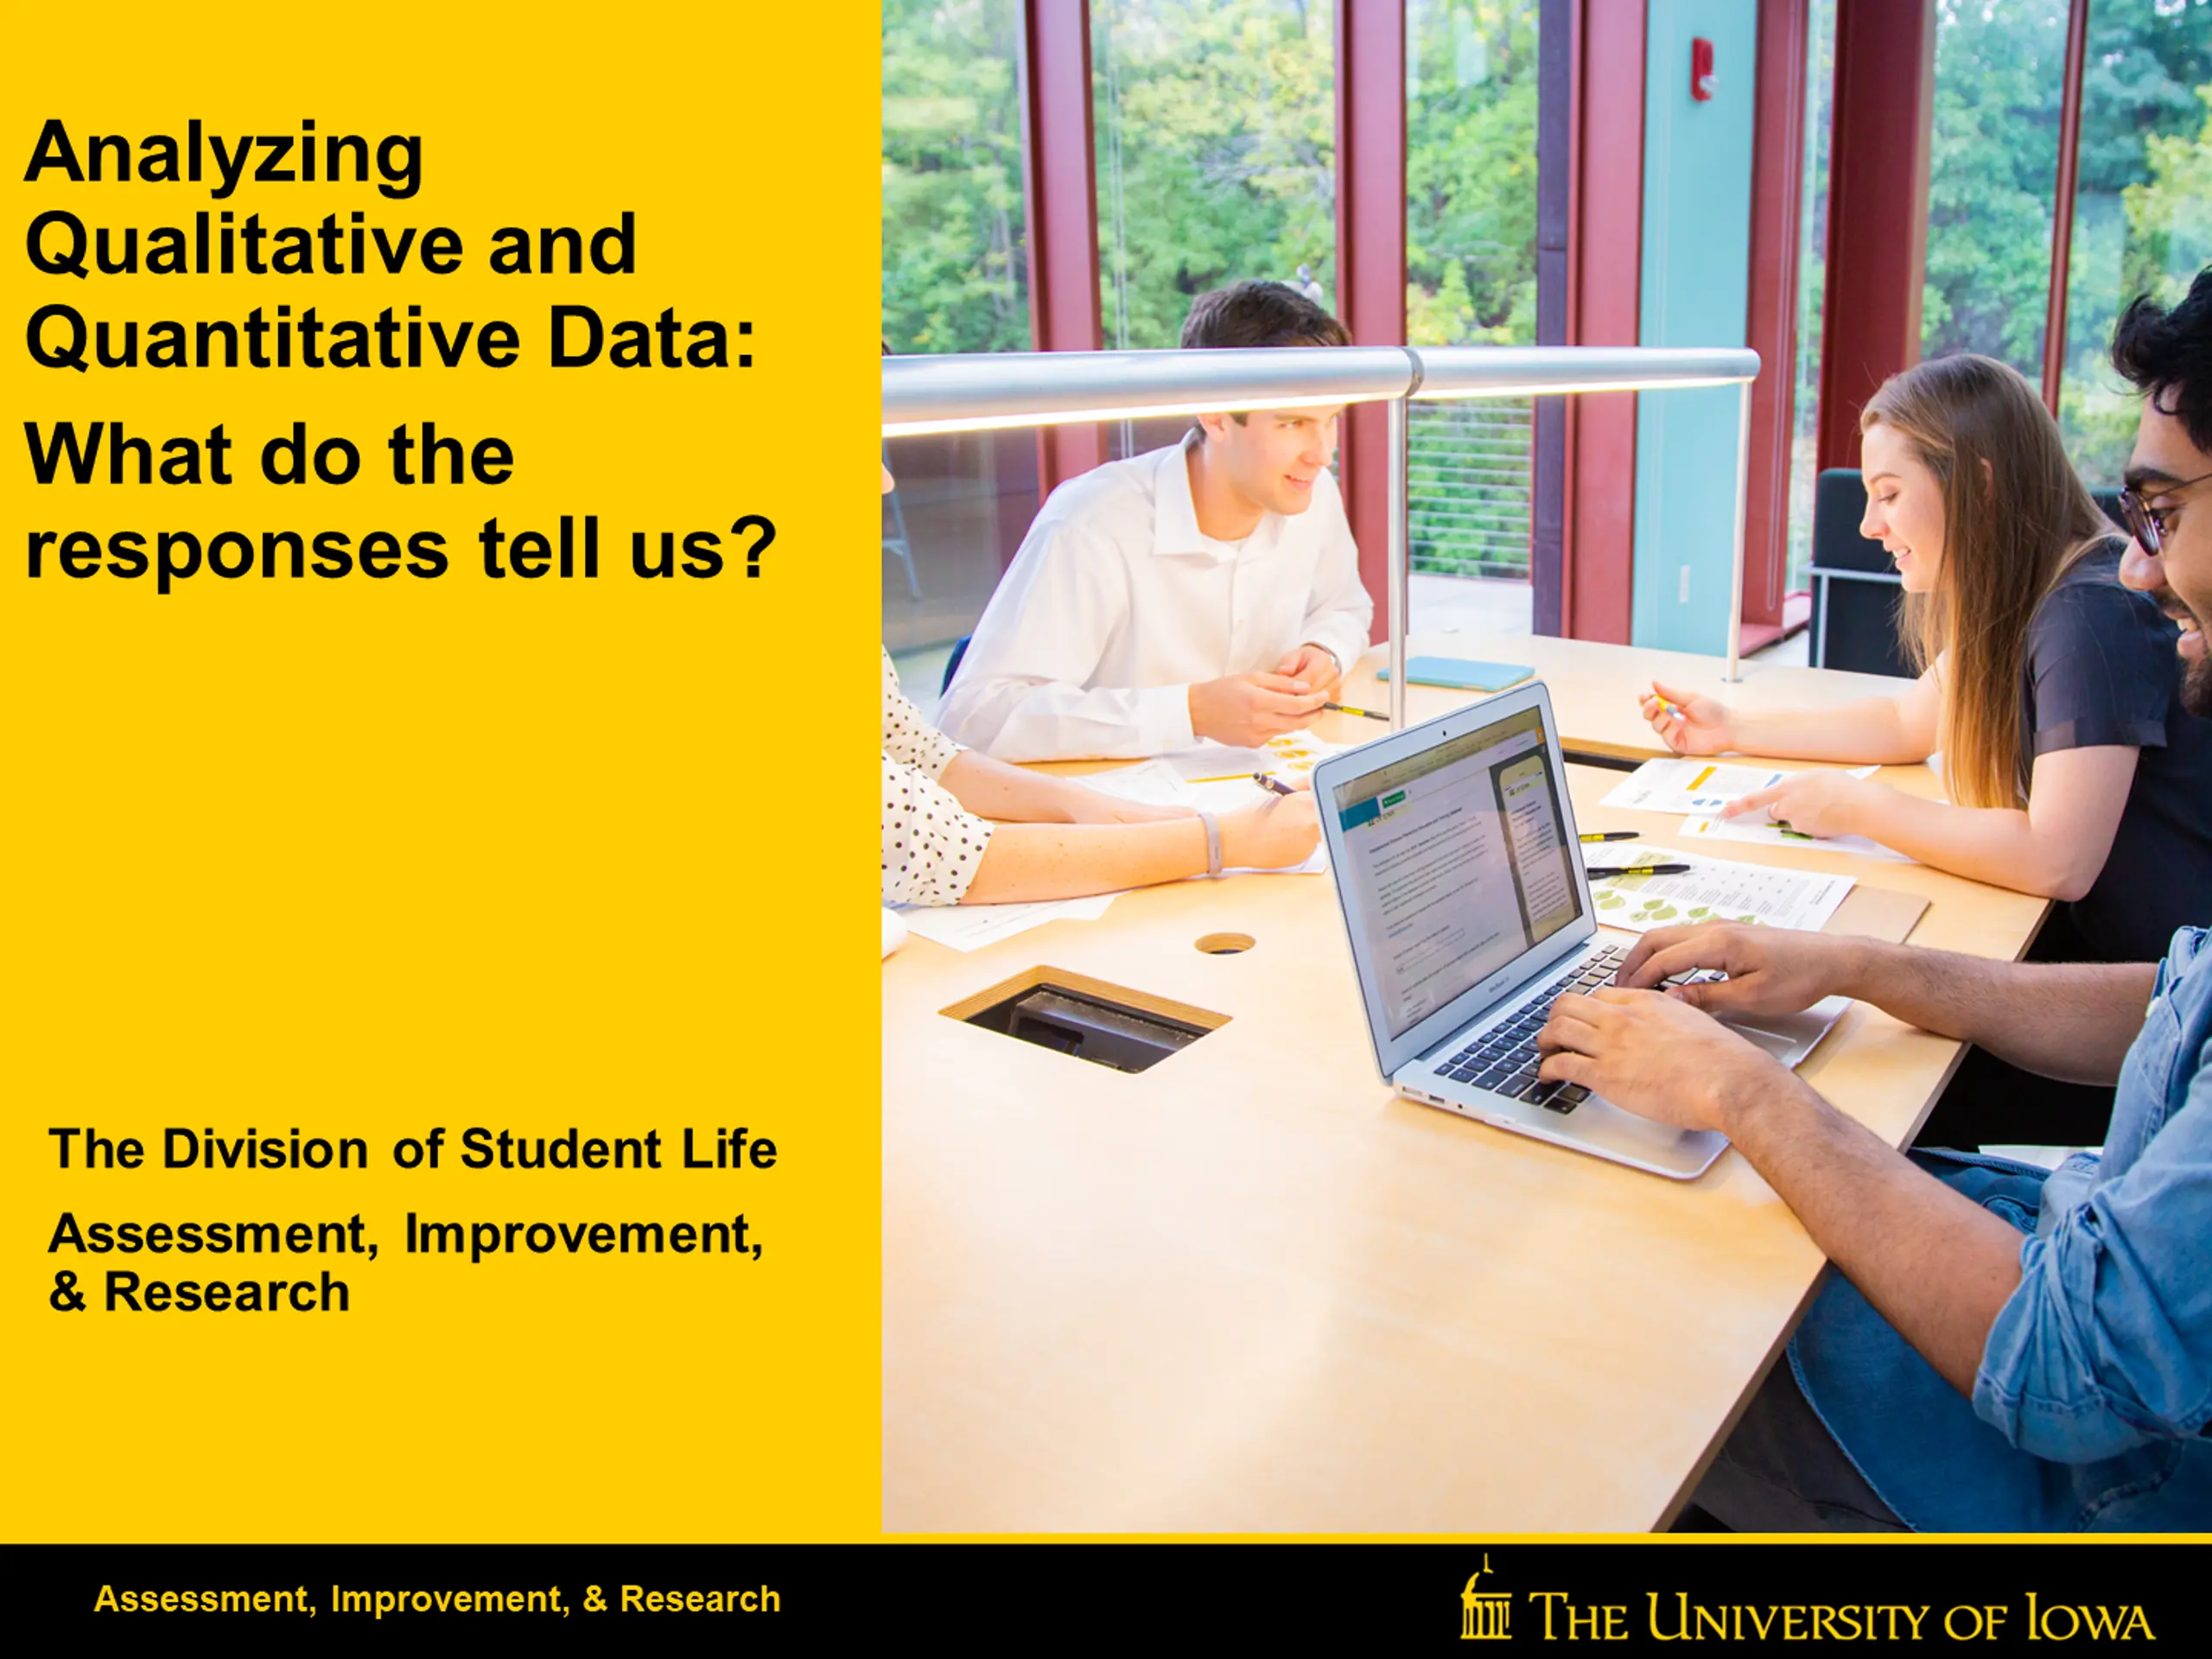
Analyzing Qualitative and Quantitative Data: What do the responses tell us? The Division of Student Life Assessment, Improvement, & Research Assessment, Improvement, & Research
AIR Mission The mission of Student Life Assessment, Improvement, & Research (AIR) is to lead outcomes-based assessment in the co- curricular setting, support evidence-based decision- making, and promote a culture focused on the continuous improvement of programs and services. Assessment, Improvement, & Research
Learning Outcomes As a result of this workshop participants will be able to Describe the difference between quantitative and qualitative data analysis Apply the steps of quantitative and qualitative data analysis in their own work Compare and contrast various data analysis platforms/software Assessment, Improvement, & Research
ACPA/NASPA Professional Competency Assessment, Evaluation, and Research (AER) Select AER methods, methodologies, designs, and tools that fit with research and evaluation questions and with assessment and review purposes. Facilitate appropriate data collection for system/department-wide assessment and evaluation efforts using current technology and methods. Effectively articulate, interpret, and apply results of AER reports and studies, including professional literature. Assessment, Improvement, & Research
Outline Qualitative Data vs. Quantitative Data Qualitative Data Analysis Overview Coding Exercise Quantitative Data Analysis Overview Data Analysis Software 3:2:1 Activity Assessment, Improvement, & Research
Assessment any effort to gather, analyze, and interpret evidence that describes institutional, departmental, divisional, or agency effectiveness (Upcraft & Schuh, 1996, p. 18). In practice, assessment is making decisions based on [systematically collected] evidence vs. instinct or tradition. Assessment, Improvement, & Research
Assessment Cycle Identify Gather Evidence Interpret Evidence Implement Change Repeat Goals/Outcomes Assessment, Improvement, & Research
Data analysis is the process of bringing order, structure, and meaning to the mass of collected data. It is a messy, ambiguous, time-consuming, creative, and fascinating process. It does not proceed in linear fashion; it is not neat. (Marshall & Rossman, 1999; as cited in Elkins, 2009) What does the data tell you about whether the program/service accomplished its intended purpose? Assessment, Improvement, & Research
Approach to analysis depends on the nature of the data Qualitative data Describes things in terms of categorizations or qualities Examples: Responses to a survey that asks students to define leadership in their own words. Notes and recordings from a focus group in which students responded to the following questions Quantitative data Can be counted or expressed numerically Examples: Responses to a survey that asks students to rate their level of agreement (1=Strongly Disagree, 5=Strongly Agree) with the following statement A pile of rubrics that rate students on their understanding of the importance of physical activity Assessment, Improvement, & Research
Exercise In your groups... Take 5 minutes to discuss any previous experiences you have had working with qualitative and/or quantitative data Be prepared to share out to the large group! Assessment, Improvement, & Research
Qualitative Data Analysis Qualitative data analysis is a search for general statements about relationships among categories of data (Marshall & Rossman, 1999; as cited in Elkins, 2009). Qualitative data is often rich in detail Coding: Organizing and making sense of textual information resulting from a study by determining themes (categories) in the data. (Bogdan & Biklen, 1998) Assessment, Improvement, & Research
Qualitative Data Analysis The process: Organize the data Give the data a once-over, noting initial impressions Categorize the data You can (a) determine the categories ahead of time, (b) allow the categories to emerge from the data, or (c) do both You may end up with categories of categories (i.e. categories and subcategories) This is an iterative process Assessment, Improvement, & Research
Qualitative Data Analysis The process (continued): Determine the relative significance of each category by counting the number of times it occurs Note responses that do not fit into the categories Find compelling quotes to include in your assessment report Assessment, Improvement, & Research
Qualitative Data Analysis The process (continued): Take a step back What do the data tell you about your assessment question? What are the limitations? What are the implications? Does it lead you to make changes or confirm your approach (or both)? What, if anything, will you change about the assessment process? Assessment, Improvement, & Research
What is one thing you learned from the Excel session? To go to my professor's office hours Just to go to class and to pay attention to do well in school. Talking to professors Some of the ways to do well in my classes. I learned about asking questions, and going to office hours Semester-hour expectations for each semester and graduation You need to go to lecture halls! to pay attention in lecture. Some expectations of the college learning environment. how to be a good student Be where you need to be and when you need to be there The online classes you can take to do my best Don't be afraid to talk to your professors. Go to classes/office hours. It is important to go above and beyond Can't remember Assessment, Improvement, & Research
Emerging Categories Theme Academic behaviors/skills Professors/TAs (office hours, get to know them) Expectations (class, academics, professors) Challenge yourself Don t remember Code 1 2 3 4 5 Code 2 Response To go to my professor's office hours 3 Some expectations of the college learning environment. 4 2 To challenge myself and talk to my professors Assessment, Improvement, & Research
Tips Make a note and revisit later Other Category Question: What is one thing you learned from the Excel session? The leader gave her own input so it calmed down some of the nerves. Junk Category Question: What do you like most about college? My biceps. Assessment, Improvement, & Research
What is one thing you learned from the Excel session? Themes Academic skills Nothing/Don t remember Professors/TAs (office hours, get to know them) Other Expectations (class, academics, professors) Responsibility/Balance Time-management Excel/Challenge yourself/Set goals College versus High School Credit requirements/Grading Percentages (of 543) 29% 22% 11% 9% 8% 7% 5% 5% 2% 2% Assessment, Improvement, & Research
Emerging Categories Cont. Sample Quotes: Attending classes is more than just being in class, you need to participate. It was too generic. The only thing that was positive about the Excel sessions is when the group leaders went off topic and told about ways that they could be successful and inside tips that they have learned. That college professors and TAs are willing to help students, and aren't as mean or scary as one might think. Assessment, Improvement, & Research
Exercise In your previous groups... Take 5 minutes to determine what categories you see in the table of responses provided in the "first look at themes" document What do the responses tell us? Assessment, Improvement, & Research
Quantitative Data Analysis The process: Organize the data Give the data a once-over, noting initial impressions Four analytic strategies Description (frequencies, percentages, mean, median, mode, range, standard deviation) Differences (participants vs. non-participants; do certain participants do better than others? Change (pre/post) Expectations (do students meet our expectations of learning/competency) Assessment, Improvement, & Research
Quantitative Data Analysis The process (continued): Alone, neither measures of central tendency (e.g. mean, median, mode) nor measures of variability (e.g. range, standard deviation) tell the whole story. Consider: Group 1 scores: 190, 195, 199, 200, 200, 201, 205, 210 Group 2 scores: 0, 10, 20, 200, 200, 380, 390, 400 Scores from Group 1 and Group 2 have the same central tendency but different variability Assessment, Improvement, & Research
Quantitative Data Analysis The process (continued): Just reporting the mean can be misleading. For example, average salary of State of Iowa employees is $51,000. What role might Kirk Ferentz s salary play in this figure? Consider how having the median and more might be more helpful. Assessment, Improvement, & Research
How effective was the Excel lecture at: % responding somewhat ineffective or somewhat effective % responding effective or very effective Mean response (1=very ineffective to 6=very effective) % responding very ineffective or ineffective Item Outlining the expectations for academics? 16% 44% 40% 4.0 Exercise: What do the responses tell us? Assessment, Improvement, & Research
Statistical Analysis System (SAS) A data analysis tool for high level data management Allows user access to: Retrieve information and manage data Write reports and create graphics Statistical analysis, econometrics and data mining Operations research and project management Quality improvement Data warehousing (extract, transform, load) Platform independent and remote computing Assessment, Improvement, & Research
SPSS A statistical analysis software program Facilitate complex analysis and management of statistical data Specifically designed for social science data Assessment, Improvement, & Research
STATA A data analysis tool for visualizations, observations and making inferences Allows user to: Make observations of large data sets Compare multiple variables Manage data Create visualizations Assessment, Improvement, & Research
Qualtrics A web-based survey and data collection tool for creating and conducting online surveys Conduct research, create surveys Can also utilize data analysis features to create graphics and view automated tables of quantitative data collected No cost to faculty, staff and students Assessment, Improvement, & Research
Excel A helpful tool to code large amounts of qualitative data Create codes and use filters to count themes Can create charts and create graphics of data Assessment, Improvement, & Research
3:2:1 Activity Take a moment to write down: 3 Things you learned 2 Questions you have 1 Takeaway Assessment, Improvement, & Research
Questions? Assessment, Improvement, & Research
What's Next Assessment Development Series Workshop #6 Implementing Change Based on Evidence As a result of this workshop participants will be able to Articulate the importance of evidence-based decision making Develop a plan to utilize existing data for program/service improvement How will you make decisions and implement change based on the findings?
Resources Assessment, Improvement, & Research The University of Iowa 231 Iowa Memorial Union 319-335-3557 Assessment, Improvement, & Research
