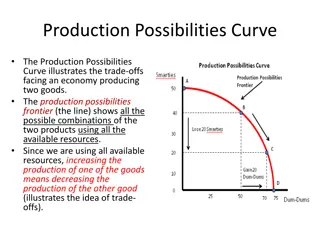
Production Possibilities Curve and Economic Growth
The Production Possibilities Curve illustrates trade-offs in an economy producing two goods, showing possible combinations using available resources. Efficiency on the curve means no way to make some better off without others worse off. Opportunity cost is the given-up production when increasing one
5 views • 5 slides
Monetary Policy Effectiveness in the IS-LM Framework
The relative effectiveness of monetary policy in influencing investment, employment, output, and income depends on the shape of the LM curve and the IS curve. A steeper LM curve signifies higher effectiveness as it indicates less interest elastic demand for money, resulting in significant changes in
2 views • 24 slides
The Normal Probability Curve
The Normal Probability Curve, also known as the normal distribution, is a fundamental concept in statistics. It is symmetric around the mean, with key characteristics such as equal numbers of cases above and below the mean, and the mean, median, and mode coinciding. The curve's height decreases grad
2 views • 10 slides

Strength-Duration Curve in Neuromuscular Stimulation
The strength-duration curve depicts the relationship between electrical stimulus intensity and time required for minimal muscle contraction. It helps assess nerve damage in lower motor neuron lesions. Various types of curves exist based on innervation status, such as normal innervation, complete den
3 views • 15 slides
Solving Exponential Equations Algebraically
Learn how to solve exponential equations algebraically with the same base and unlike bases. Understand the properties of equality for exponential equations and practice solving various equations step by step. Improve your skills in rewriting equations with the same base and applying the rules of exp
3 views • 9 slides
Exponential Growth Functions Based on Gordon's Book
This presentation delves into exponential growth functions using real-world examples such as the population growth of Niger. It covers topics such as algebra with exponents, finding formulas for growth models, terminology, and graphing population growth over time. The content explores how exponentia
7 views • 21 slides
Moving Averages and Exponential Smoothing Methods
Forecasting methods like moving averages and exponential smoothing are essential for analyzing time series data. Averaging methods involve equally weighted observations, while exponential smoothing methods assign unequal weights that decay exponentially. Both methods can be useful for forecasting in
5 views • 18 slides

Exponential Smoothing in Forecasting
Exponential smoothing is a popular method used in forecasting, where the most recent data is weighted the most. It involves a smoothing constant that ranges from 0 to 1, with little record-keeping of past data required. The method calculates new forecasts based on previous forecasts and actual deman
1 views • 38 slides
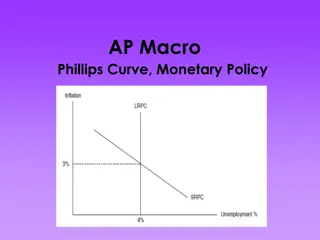
The Phillips Curve and Its Implications
The Phillips Curve, introduced by economist A.W. Phillips in 1958, initially showed an inverse relationship between unemployment rate (u%) and inflation rate (tt%). This led policymakers to consider a trade-off between reducing unemployment and increasing inflation. However, the concept faced challe
3 views • 22 slides

Nonlinear Curve Fitting Techniques in Engineering
Utilizing nonlinear curve fitting techniques is crucial in engineering to analyze data relationships that are not linear. This involves transforming nonlinear equations into linear form for regression analysis, as demonstrated in examples and methods such as polynomial interpolation and exponential
0 views • 18 slides
Fitting Exponential Functions to Data: Examples and Applications
Understanding how to fit exponential functions to data is essential for analyzing non-linear relationships. This presentation explores the process of fitting exponential functions using examples from population growth data, discussing characteristics and interpreting results. It also introduces the
1 views • 17 slides
Methods for Evaluating Matrix Exponential
This study delves into various techniques for evaluating the matrix exponential, including the Cauchy Integral Formula and Putzer's equation via Laplace Transforms. Motivated by linear ordinary differential equations, the matrix exponential is explored in depth, showcasing its applications and signi
5 views • 23 slides

Production Possibilities Curve and Economic Growth
Explore the concept of the production possibilities curve, including its assumptions, implications of being under or beyond the curve, types of opportunity costs, shifts in the curve, and the impact of economic growth on a nation's productivity and output capacity.
1 views • 18 slides
The Learning Curve Phenomenon in Manufacturing
Performance improvement in manufacturing is described by the learning curve, where labor input per unit decreases as experience grows. The general equation and exponential curve of learning are discussed, along with the concept of learning rate. Determining the index of learning from the learning ra
3 views • 11 slides
Exponential Growth and Decay in Biology and Math
Dive into the world of exponential growth and decay with applications to biology. Explore fitting exponential models to data, making predictions, interpreting model components, and conducting sensitivity analysis. Learn how to graph exponential functions and understand the importance of mathematics
4 views • 10 slides

Logarithmic Functions and Exponential Equations
In this unit, learn how to write and evaluate logarithmic expressions, solve exponential equations using common bases, work with exponential and logarithm equations, understand logarithmic form, and find the inverse of functions. Practice solving equations with various bases and learn to convert bet
3 views • 7 slides

Exponential and Logarithmic Equations Exploration
Discover the principles of solving exponential and logarithmic equations with examples and step-by-step guides. Learn how to manipulate expressions on both sides to find the variable. Utilize logarithms to simplify exponential equations effectively.
1 views • 10 slides

Exponential Entrepreneur Program Overview
Exponential Entrepreneur Program is a yearlong course introducing students to fast-growing technologies. The program aims to equip students with knowledge in exponential technology and entrepreneurship, fostering hands-on experience, research, and innovative projects. The curriculum includes intense
0 views • 8 slides

Exponential Growth and Decay in Mathematics
Explore the concepts of exponential growth and decay in mathematics, where functions involve multiplying by a predictable factor to obtain different coordinate points. Learn how exponential growth occurs when a value increases by a multiplier, such as the doubling of bacteria in a petri dish. Discov
1 views • 24 slides

Exponential Random Graphs in Network Structures
Explore the concept of exponential random graphs and their application in analyzing different network structures. Learn about ensemble models of networks, defining probabilities for graphs, maximizing entropy, and the partition function in graph theory. Gain insights into the possibilities and const
3 views • 42 slides

Exponential Growth Functions Study Based on Gordon's Book
Explore exponential growth functions in this presentation based on the book "Functions, Data, and Models" by S.P. Gordon and F.S. Gordon. Learn about algebra with exponents, solving problems, finding formulas, terminology, and analyzing population growth in Niger over time. Understand the concept of
4 views • 21 slides

Nonlinear Regression Models and Exponential Models
Discover the world of nonlinear regression models and exponential models in data analysis. Learn about popular models like exponential, power, saturation growth, polynomial, and logistic. Explore how to find the constants of an exponential model through differentiation and second derivative tests.
1 views • 56 slides

Exponential Time Paradigms in Algorithmic Studies
Explore the insights into exponential time paradigms through the lens of polynomial time, discussing scalability patterns, FPT algorithms, dynamic programming, and more. Delve into lower bounds, branching strategies, and evaluation of exponential sums in algorithmic models.
1 views • 22 slides

Exponential Models for Predicting Growth
Explore the concept of exponential models in mathematics for predicting growth in various aspects of society such as population, money, and pollution. Learn how to simplify exponential functions and graph exponential equations. A practical example demonstrates how exponential models can be used to p
0 views • 27 slides

Empowering Women Leaders: NUS's Exponential Technologies Program
Partnering with the Women Initiative Foundation (WIF), NUS Executive Education offers the "Placing a Bet on the Future: Exploring Exponential Technologies Program" for women leaders and entrepreneurs. The program focuses on attaining a new mindset, achieving exponential thinking, and navigating disr
1 views • 4 slides

Exponential Growth and the Naperian Constant
Explore the concept of exponential growth, the significance of the Naperian constant 'e', and how it is used in growth equations and population calculations. Learn about exponential growth rates, graphing, the relationship between N and t, and the concept of doubling time. Dive into solving problems
0 views • 23 slides

Nonlinear Regression Models and Exponential Model Analysis
Explore popular nonlinear regression models such as exponential, power, saturation growth, and polynomial models. Understand the process of finding constants for the exponential model through differentiation and equations. An example involving the relative intensity of radiation over time is also pr
3 views • 17 slides

Introduction to Logarithmic Functions
In this introduction to logarithmic functions, learn about the inverse relationship with exponential functions, graphical reflections, algebraic processes, and more. Explore the characteristics, domain, and range of exponential functions and how to find the inverse of an exponential function both gr
3 views • 27 slides

Exponential Functions and Their History in Mathematics
Explore the concept of exponential functions, their historical development, equations, and applications in mathematics. Learn about the fundamental properties, derivatives, complex exponential numbers, and series expansions. Dive deeper into the fascinating world of exponentials with this insightful
5 views • 24 slides

Exponential Numbers in Mathematics
Explore the concept of exponential numbers and their various forms, including exponential notation, floating point notation, scientific notation, precision, and rounding. Learn how to express numbers in different formats and understand the relevance of mantissa, exponent, and significant figures in
2 views • 9 slides

Fitting Exponential Functions to Data for Modeling Relationships
Learn how to fit exponential functions to data and create models using scatterplots and regression analysis. Understand the characteristics of exponential functions and their applications in real-world scenarios.
6 views • 17 slides

Understanding Exponential Functions and Graphs
Explore the world of exponential functions with detailed graphs showcasing their behavior and characteristics. Gain insights into the fundamentals of exponential functions through engaging visuals and explanations.
0 views • 5 slides

Understanding Exponential Functions and Graphing
Explore exponential functions, growth, decay, and how to evaluate and graph them. Delve into examples, growth factors, decay factors, and linear vs. exponential functions. Discover scenarios like beetle population growth and restaurant spending trends.
3 views • 15 slides

Exponential Functions and Growth Scenarios in Mathematics
Explore exponential functions through real-life scenarios such as bacterial growth and zombie virus infection, solve practice problems on linear and exponential functions, and delve into drug filtering calculations. Learn to write explicit rules for exponential functions and calculate percent increa
0 views • 16 slides

Understanding Key Features of Exponential Functions
Learn about the key characteristics of exponential functions, such as growth, decay, asymptotes, and y-intercepts. Explore the concept with examples and graphs, including the fascinating case of the U.S.S. Arizona oil leakage. Dive into the world of exponential functions in this informative lesson.
0 views • 36 slides

Solving Exponential Equations Using Logarithms - Step by Step Guide
Learn how to solve exponential equations using logarithms in this comprehensive guide. Understand the properties involved and follow detailed examples to improve your mathematical skills. Enhance your problem-solving abilities with practical applications and discover the power of logarithms in solvi
3 views • 34 slides

Exponential Series in Algebra: Understanding and Applications
Explore the world of Exponential Series in Algebra through this insightful presentation by Hossain Md. Waseem Firoz, an Instructor in Mathematics at Kushtia Polytechnic Institute. Dive into the fundamentals, solving problems, and applications of Exponential Series in a comprehensive manner. Discover
1 views • 11 slides

Introduction to the Theory of Statistics: Order Statistics and Exponential Families
Explore the concepts of order statistics and exponential families in statistics with examples and homework questions to test your understanding. Analyze density functions to determine if they belong to the exponential family.
2 views • 14 slides

Fit Exponential Curve: Step-by-Step Calculation Guide
Learn how to fit an exponential curve using regression and correlation analysis. This detailed guide provides a step-by-step calculation process with examples, from transforming the equation to finding the final fitted equation. Understand the procedure to fit an exponential curve efficiently.
5 views • 12 slides

Exponential Functions Simplified
Learn how to simplify exponential functions, rationalize denominators, and solve equations. Understand the characteristics of exponential functions and the natural base 'e.' Find the approximate values and graph exponential functions to enhance your understanding. Explore the basics of exponential f
0 views • 18 slides