
Buy Block Heels for Women Online in India 9threadz
\nLooking to elevate your style with the perfect pair of block heels? Look no further than 9threadz, your go-to destination for fashionable footwear online in India. Whether you're dressing up for a special occasion or simply want to add a touch of sophistication to your everyday look, our collectio
2 views • 4 slides
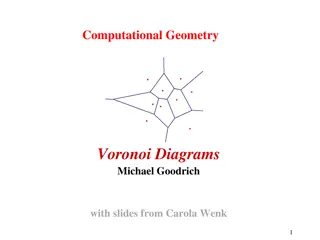
Computational Geometry.
Voronoi diagrams, a key concept in computational geometry, involve partitioning a space based on points sites. They have diverse applications like nearest neighbor queries and facility location. The diagrams consist of Voronoi cells, edges, and vertices, forming a connected graph. Properties include
0 views • 19 slides

The Joy of Sets: Graphical Alternatives to Euler and Venn Diagrams
Graphical representations of set membership can be effectively portrayed using alternatives to traditional Euler and Venn diagrams. Learn about upset plots, indicating set membership graphically, and the use of Venn or Euler diagrams as solutions. Explore the historical context and challenges with V
2 views • 43 slides
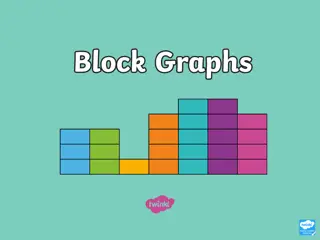
Understanding Block Graphs: Examples and Explanations
A block graph visually represents discrete data in a collection of blocks with no gaps between them. Each block must be carefully drawn with a title and axes labeled to explain the data shown. Examples include surveys on favorite activities, zoo animal sightings, and chocolate wrapper colors. Learn
0 views • 8 slides
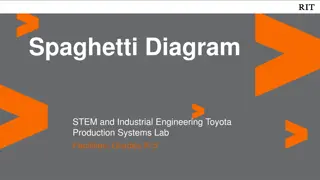
Exploring Spaghetti Diagrams in STEM Education for Grades K-5
Dive into the world of Spaghetti Diagrams through industrial engineering concepts taught in a Toyota Production Systems Lab for students in Grades K-5. Understand the flow of movement in spaces like houses, learn to create spaghetti diagrams, and discover how they can be applied to rearrange rooms a
0 views • 20 slides

Business Mathematics: Various Bar Diagrams and Charts Explained
This comprehensive guide covers the concepts of sub-divided bar diagrams, duo-directional bar diagrams, sliding bar diagrams, and pie charts in Business Mathematics. It includes definitions, examples, and solutions to help understand how to represent data effectively using these graphical tools. Ms.
0 views • 15 slides

Network Diagrams for Resource Management Techniques
Examples of network diagrams and arrow diagrams for different relationships in resource management techniques are provided. The diagrams illustrate activity sequences, dependencies, and solutions for various scenarios. These visual representations aid in planning, scheduling, and managing resources
1 views • 6 slides

Math Quiz and Venn Diagrams
Venn diagrams for sorting numbers, probability calculations, the concept of angles in straight lines, and various math questions including factors, multiples, ratios, and conversion between 12-hour and 24-hour clocks are discussed in this educational content. The content also illustrates scenarios w
0 views • 25 slides

Comparison of Erector Spinae Plane Block vs Serratus Anterior Plane Block in Thoracic Surgery Recovery
Minimally Invasive Thoracic Surgery often results in severe post-operative pain, typically managed with the Serratus Anterior Plane (SAP) block. This study compared the quality of recovery and morbidity between SAP and the relatively new Erector Spinae Plane (ESP) block. Results showed that ESP prov
1 views • 10 slides

Understanding UML Sequence Diagrams and Their Applications
UML sequence diagrams depict how objects interact in a given scenario, showcasing messages sent between targets on lifelines. They are valuable for detailing use cases, modeling logic, task flow between components, and understanding process functionality. Objects, boundaries, controls, and stereotyp
1 views • 30 slides
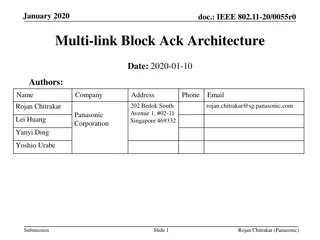
IEEE 802.11-20/0055r0 Multi-link Block Ack Architecture Overview
This document from January 2020 presents an overview of the IEEE 802.11-20/0055r0 Multi-link Block Ack architecture proposed by Rojan Chitrakar from Panasonic. It discusses the negotiation of block ack agreements between multiple MLDs, common sequence number assignment, transmit and receive buffers,
1 views • 11 slides

Understanding Structured Analysis in Software Design
Structured analysis in software design aims to describe customer requirements, create a basis for software design, and define validatable requirements. Two main modeling philosophies, structured analysis, and object-oriented analysis are discussed. Structured Analysis Model Elements such as Data Flo
1 views • 44 slides

Classification of Elements and Periodicity in Properties: Overview and Evolution
The journey of understanding the classification of elements and periodicity in properties begins with early laws like the Law of Triads and Newland's Law of Octaves. Mendeleev's Periodic Law revolutionized the organization of elements, leading to the modern periodic table. Discoveries of eka-alumini
3 views • 32 slides

Interactive Lesson on Venn Diagrams and Shading Regions
Dive into a comprehensive tutorial on Venn diagrams highlighting the process of populating and shading regions. Access engaging resources, visual aids, and practice exercises to enhance your understanding. Test your knowledge with a quiz on Hegarty Maths and solidify your skills in displaying sets w
0 views • 15 slides
Understanding Object Behaviors and Statechart Diagrams in Software Design
Object behaviors and UML statechart diagrams play a crucial role in software requirements and design. State machines, transitions, events, and states are essential concepts in modeling object behavior in response to external events. By utilizing UML statechart diagrams, one can effectively represent
0 views • 23 slides

Understanding Sets with Venn Diagrams in Junior Certificate Ordinary Level Mathematics
Dive into the world of sets and Venn diagrams with this educational content designed for Junior Certificate Ordinary Level students. Explore shading regions, identifying subsets, and solving problems using Venn diagrams to enhance your mathematical skills.
1 views • 28 slides
Understanding Functions: Definitions and Arrow Diagrams
Recall the definition of a function, where each element in the domain is related to exactly one element in the co-domain. Arrow diagrams can visually represent functions from finite sets X to Y. In this example, a function is defined from X = {a, b, c} to Y = {1, 2, 3, 4} using arrow diagrams, showc
9 views • 28 slides

Understanding Feynman Diagrams in Particle Physics
Feynman diagrams, developed by Richard Feynman in the 1940s, are a graphical technique to represent particle interactions in space-time. These diagrams use lines to depict particles, with fermions moving forward in time and antifermions moving backward. Vertices in the diagrams represent points wher
1 views • 19 slides

Water Management Plans for Healthcare Facilities - Process Flow Diagrams
Editable water system process flow diagrams for healthcare facilities based on recommendations from CDC and ASHRAE. Includes instructions for customization and samples for various water flow scenarios. Ensures facilities can create customized diagrams tailored to their specific needs for effective w
1 views • 7 slides

D-Block Elements: Properties and Classification in Chemistry
Welcome to the Department of Chemistry at Kisan Veer Mahavidyalaya, Wai. Explore the Chemistry of Elements of the 3d series, focusing on d-Block Elements and Transition Elements. Learn about their electronic structure, colored ions, magnetic properties, oxidation states, and complex formation. Under
0 views • 34 slides
Understanding Block Ciphers in Cryptography
Explore the principles of block ciphers in modern cryptography, focusing on the Data Encryption Standard (DES) and its design principles. Learn about block cipher encryption, Feistel block cipher structure, n-bit block ciphers, ideal block ciphers, key length considerations, and challenges with idea
0 views • 44 slides

Taekwondo Techniques and Blocks: Defensive Moves in Action
Explore Taekwondo techniques such as the Down Block, X-Block, Knife-Hand Block, and Double Knife-Hand Block, used for defense against different types of attacks in martial arts. Detailed descriptions and illustrations demonstrate how to execute these blocks effectively to protect various parts of th
1 views • 25 slides

Taekwondo Techniques - Basics and Blocks for Self-Defense
Explore the fundamental Taekwondo techniques focusing on blocking movements for self-defense. Learn about Down Block, X-Block, Knife-Hand Block, and Double Knife-Hand Block with detailed descriptions and images illustrating each move. Enhance your understanding of these essential blocks in Taekwondo
4 views • 11 slides

Overview of Loop Diagrams in Process Control Systems
Loop diagrams are essential documents in process control systems, providing schematic representations of hydraulic, electric, magnetic, or pneumatic circuits. They detail instrumentation arrangements, signal connections, power connections, and termination information. Guidelines and standards for cr
1 views • 5 slides

Various Quality Improvement Diagrams for Root Cause Analysis
Explore a series of quality improvement diagrams such as fishbone diagrams, cause-and-effect flow charts, error reduction improvement diagrams, and root cause analysis steps. These visual tools offer insights into identifying and addressing root causes of issues in different processes or systems.
0 views • 12 slides

Key Driver Diagrams in Continuous Quality Improvement
Key Driver Diagrams are essential tools in Continuous Quality Improvement (CQI) to help organizations achieve their goals by identifying key drivers and their relationships. These diagrams aid in understanding complex systems, setting SMART aims, and implementing effective change strategies. Through
0 views • 24 slides
MLA Style Guide for Block Quotations
Learn how to format block quotations according to MLA style guidelines. Use a block quote for material longer than four lines, indent one inch from the left margin, and type it double-spaced without quotation marks. Remember to introduce block quotations with a colon.
0 views • 4 slides

Understanding Activity Diagrams and State Chart Diagrams
Activity diagrams describe the workflow behavior of a system by showing the sequence of activities performed, including conditional and parallel activities. Elements such as Initial Activity, Symbol Activity, Decisions, Signals, Concurrent Activities, and Final Activity are depicted in these diagram
0 views • 10 slides

Understanding UML Package Diagrams and Components in Software Design
UML package diagrams are essential in organizing model elements such as use cases and classes into groups for a better structure in system modeling. They help in providing a high-level overview of requirements and architecture, logically modularizing complex diagrams, and indicating dependencies bet
0 views • 38 slides

Taekwondo Training: Block Techniques Explained
Dive into the world of Taekwondo block techniques with detailed descriptions and images of essential blocks such as Down Block, X Block, Knife-Hand Block, and Double Knife-Hand Block. Learn the proper execution and applications of each block to enhance your defensive skills in martial arts.
0 views • 25 slides

Taekwondo Techniques for Defense: Blocks and Movements
Explore the fundamental blocking techniques in Taekwondo, including the Down Block, X-Block, Knife-Hand Block, and Double Knife-Hand Block. Learn the proper execution and defense strategies against different types of attacks targeting various body sections. Enhance your skills and understanding of s
0 views • 11 slides

Understanding Testing in Software Engineering
In the previous session, we discussed various aspects of software engineering, including modeling with UML diagrams, such as activity diagrams, use case diagrams, sequence diagrams, state diagrams, and class diagrams, as well as architecture patterns. Testing was emphasized as a key aspect, highligh
0 views • 35 slides

Understanding UML Activity Diagrams in Software Design
UML Activity Diagrams provide a modern way to visualize business processes, workflows, data flows, and complex algorithms in software systems. They use symbols to represent different parties involved, actions performed, transitions, and control flows. These diagrams help in modeling data flows, obje
0 views • 14 slides
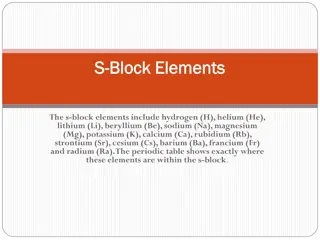
Understanding S-Block Elements in the Periodic Table
The s-block elements in the Periodic Table consist of 14 elements with unique properties and characteristics. Lithium, sodium, and potassium are notable members of Group 1, characterized by their reactivity and ability to form alkaline solutions when in contact with water. These soft metals exhibit
0 views • 23 slides

Guide for File Download Block Creation
In this guide, you will learn how to create a file download block on your webpage step by step. First, you need to click the small plus symbol, then initiate the file download process. You can customize the title, format, text color, and background theme accordingly. Finally, you can choose when and
0 views • 34 slides
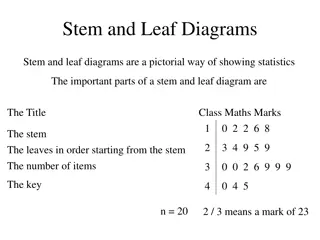
Exploring Stem and Leaf Diagrams for Statistical Analysis
Stem and leaf diagrams provide a visual way to represent statistical data effectively. This article showcases examples of stem and leaf diagrams for various datasets, including math marks, pulse rates, pocket money, speeds of cars, distances in meters, and comparison between two classes. The diagram
0 views • 6 slides
Understanding Sequence Diagrams in Software Development
Sequence diagrams depict the sequence of actions in a system, capturing the invocation of methods in objects. They are a valuable tool for representing dynamic system behavior. Message arrows in sequence diagrams indicate communications between objects, illustrating synchronous and asynchronous mess
0 views • 21 slides
Understanding Venn Diagrams and Categorical Syllogisms
Venn diagrams, introduced by John Venn, visually represent relationships between different classes. Shading in diagrams signifies empty sets or no overlap between classes. Different types of categorical statements such as universal and particular are illustrated using examples. Explore how Venn diag
0 views • 30 slides

Power System Dynamics and Stability: Exciters and Block Diagrams Overview
Explore the concepts of exciters and block diagrams in power system dynamics and stability through lectures by Prof. Tom Overbye at the University of Illinois. Learn about IEEE exciter models, including the evolution from T1 to DC1A, and delve into block diagram basics for simulating power system mo
0 views • 31 slides

Software Process Modeling State Diagrams Lab Exercises
Dive into the world of state diagrams and state machine diagrams in software process modeling. Explore hands-on exercises such as creating state diagrams for controlling air conditioners and garage doors. Understand the importance of capturing object states in OOP and learn how to represent transiti
0 views • 7 slides