
mRNA Chromatography Applications: Resin Types and Purification Efficiency
This content delves into mRNA chromatography applications, focusing on the mRNA purification process using dT affinity chromatography, IEX, HIC, and RP techniques. It discusses the application of mRNA affinity resins like Monomix dT20 and Proteomix POR50-dT20, highlighting their properties, purifica
4 views • 8 slides

Network Function Abstraction A delicate question of (CPU) affinity?
Exploring the delicate balance of CPU affinity in network function abstraction, including challenges, benefits, and solutions like CPU pinning for network workloads. Learn about the impact on performance and scalability, as well as the importance of proper configuration in virtual and physical envir
3 views • 40 slides
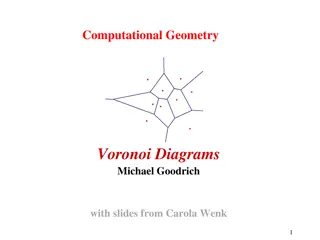
Computational Geometry.
Voronoi diagrams, a key concept in computational geometry, involve partitioning a space based on points sites. They have diverse applications like nearest neighbor queries and facility location. The diagrams consist of Voronoi cells, edges, and vertices, forming a connected graph. Properties include
0 views • 19 slides

The Joy of Sets: Graphical Alternatives to Euler and Venn Diagrams
Graphical representations of set membership can be effectively portrayed using alternatives to traditional Euler and Venn diagrams. Learn about upset plots, indicating set membership graphically, and the use of Venn or Euler diagrams as solutions. Explore the historical context and challenges with V
2 views • 43 slides
Exploring Spaghetti Diagrams in STEM Education for Grades K-5
Dive into the world of Spaghetti Diagrams through industrial engineering concepts taught in a Toyota Production Systems Lab for students in Grades K-5. Understand the flow of movement in spaces like houses, learn to create spaghetti diagrams, and discover how they can be applied to rearrange rooms a
0 views • 20 slides

Business Mathematics: Various Bar Diagrams and Charts Explained
This comprehensive guide covers the concepts of sub-divided bar diagrams, duo-directional bar diagrams, sliding bar diagrams, and pie charts in Business Mathematics. It includes definitions, examples, and solutions to help understand how to represent data effectively using these graphical tools. Ms.
0 views • 15 slides

Principles of Staining in Histopathologic Techniques
Beginning with an introduction to staining in biochemical techniques, this chapter delves into the types of stains, factors influencing selectivity, and commonly used stains in histopathology. Learning objectives include defining staining, discussing dye-tissue affinity, understanding selectivity fa
2 views • 107 slides

Network Diagrams for Resource Management Techniques
Examples of network diagrams and arrow diagrams for different relationships in resource management techniques are provided. The diagrams illustrate activity sequences, dependencies, and solutions for various scenarios. These visual representations aid in planning, scheduling, and managing resources
1 views • 6 slides

Math Quiz and Venn Diagrams
Venn diagrams for sorting numbers, probability calculations, the concept of angles in straight lines, and various math questions including factors, multiples, ratios, and conversion between 12-hour and 24-hour clocks are discussed in this educational content. The content also illustrates scenarios w
0 views • 25 slides

Understanding UML Sequence Diagrams and Their Applications
UML sequence diagrams depict how objects interact in a given scenario, showcasing messages sent between targets on lifelines. They are valuable for detailing use cases, modeling logic, task flow between components, and understanding process functionality. Objects, boundaries, controls, and stereotyp
1 views • 30 slides

Understanding Structured Analysis in Software Design
Structured analysis in software design aims to describe customer requirements, create a basis for software design, and define validatable requirements. Two main modeling philosophies, structured analysis, and object-oriented analysis are discussed. Structured Analysis Model Elements such as Data Flo
1 views • 44 slides
Understanding Column Chromatography: Methodology, Advantages, Disadvantages, and Applications
Column chromatography, a type of adsorption chromatography, involves separating components based on their affinity to an adsorbent. The methodology includes passing a solvent through a column to improve separation, obtaining a chromatogram, and eluting components for analysis. The principle relies o
2 views • 24 slides

Interactive Lesson on Venn Diagrams and Shading Regions
Dive into a comprehensive tutorial on Venn diagrams highlighting the process of populating and shading regions. Access engaging resources, visual aids, and practice exercises to enhance your understanding. Test your knowledge with a quiz on Hegarty Maths and solidify your skills in displaying sets w
0 views • 15 slides

Understanding Object Behaviors and Statechart Diagrams in Software Design
Object behaviors and UML statechart diagrams play a crucial role in software requirements and design. State machines, transitions, events, and states are essential concepts in modeling object behavior in response to external events. By utilizing UML statechart diagrams, one can effectively represent
0 views • 23 slides
Affinity Care Lipid Pathway Summary and Assessment
The Affinity Care Lipid Pathway outlines a systematic approach to assessing lipid/cholesterol blood results in individuals over 16 years old. It includes guidelines for managing cholesterol levels, assessing familial hypercholesterolemia, and determining appropriate medication options based on indiv
0 views • 5 slides
Understanding Sets with Venn Diagrams in Junior Certificate Ordinary Level Mathematics
Dive into the world of sets and Venn diagrams with this educational content designed for Junior Certificate Ordinary Level students. Explore shading regions, identifying subsets, and solving problems using Venn diagrams to enhance your mathematical skills.
1 views • 28 slides
Understanding Functions: Definitions and Arrow Diagrams
Recall the definition of a function, where each element in the domain is related to exactly one element in the co-domain. Arrow diagrams can visually represent functions from finite sets X to Y. In this example, a function is defined from X = {a, b, c} to Y = {1, 2, 3, 4} using arrow diagrams, showc
8 views • 28 slides

Understanding Energy Transfers with Sankey Diagrams
Sankey diagrams are visual tools that depict energy transfers within a system, offering insights into efficiency and energy distribution. By examining the width of arrows representing energy flow, one can analyze useful and wasted energy outputs. Inefficient systems show a disproportionate amount of
1 views • 9 slides

Understanding Feynman Diagrams in Particle Physics
Feynman diagrams, developed by Richard Feynman in the 1940s, are a graphical technique to represent particle interactions in space-time. These diagrams use lines to depict particles, with fermions moving forward in time and antifermions moving backward. Vertices in the diagrams represent points wher
1 views • 19 slides
Understanding Quantitative Aspects of Drug Action
Explore the quantitative aspects of drug action, including drug receptor binding, concentration binding curves, dose-response curves, and types of antagonism. Learn to relate drug concentration to receptor binding capacity and response produced. Discover how concentration binding curves and dose-res
0 views • 29 slides

Water Management Plans for Healthcare Facilities - Process Flow Diagrams
Editable water system process flow diagrams for healthcare facilities based on recommendations from CDC and ASHRAE. Includes instructions for customization and samples for various water flow scenarios. Ensures facilities can create customized diagrams tailored to their specific needs for effective w
1 views • 7 slides

System Sequence Diagrams: Understanding Artifact for System Behavior
System Sequence Diagrams (SSDs) are vital artifacts that visually illustrate input and output events related to a system. They help define system behavior and interactions, making them essential during the logical design phase of software applications. By depicting events in sequential order, SSDs o
2 views • 24 slides
Affinity Chromatography: A Breakthrough in Biochemical Research
Affinity chromatography, developed in the 1930s by A. Wilhelm Tiselius, is a vital technique for studying enzymes and proteins. It relies on the specific affinity between biochemical compounds and utilizes matrices like agarose for binding sites. Ligands such as amino and hydroxyl groups play crucia
1 views • 27 slides

Overview of Loop Diagrams in Process Control Systems
Loop diagrams are essential documents in process control systems, providing schematic representations of hydraulic, electric, magnetic, or pneumatic circuits. They detail instrumentation arrangements, signal connections, power connections, and termination information. Guidelines and standards for cr
1 views • 5 slides

Various Quality Improvement Diagrams for Root Cause Analysis
Explore a series of quality improvement diagrams such as fishbone diagrams, cause-and-effect flow charts, error reduction improvement diagrams, and root cause analysis steps. These visual tools offer insights into identifying and addressing root causes of issues in different processes or systems.
0 views • 12 slides
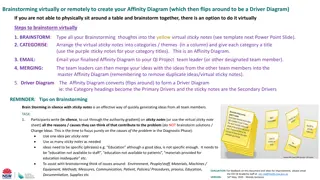
Virtual Affinity Diagram Creation for Remote Collaboration
When physical brainstorming sessions are not possible, teams can utilize virtual tools to create an Affinity Diagram remotely. Participants can brainstorm ideas on virtual sticky notes, categorize them, email the finalized diagram to team leaders, and then merge ideas into a Driver Diagram. This pro
0 views • 4 slides

Key Driver Diagrams in Continuous Quality Improvement
Key Driver Diagrams are essential tools in Continuous Quality Improvement (CQI) to help organizations achieve their goals by identifying key drivers and their relationships. These diagrams aid in understanding complex systems, setting SMART aims, and implementing effective change strategies. Through
0 views • 24 slides

Understanding Affinity Representation in Chapter Leadership
Explore the role of an affinity representative in chapter leadership, including the purpose, benefits, and steps to implement affinity programming. Learn how affinity reps engage diverse alumni groups for enhanced chapter programming and alumni engagement.
0 views • 15 slides
Understanding Graph Theory for Image Processing
Exploring the concepts of fitting, grouping, and affinity measurement in image processing through examples of weighted graph computations and clustering algorithms. Discover how images are represented as graphs and the significance of symmetry in affinity matrices.
0 views • 58 slides

Understanding Activity Diagrams and State Chart Diagrams
Activity diagrams describe the workflow behavior of a system by showing the sequence of activities performed, including conditional and parallel activities. Elements such as Initial Activity, Symbol Activity, Decisions, Signals, Concurrent Activities, and Final Activity are depicted in these diagram
0 views • 10 slides

Understanding UML Package Diagrams and Components in Software Design
UML package diagrams are essential in organizing model elements such as use cases and classes into groups for a better structure in system modeling. They help in providing a high-level overview of requirements and architecture, logically modularizing complex diagrams, and indicating dependencies bet
0 views • 38 slides
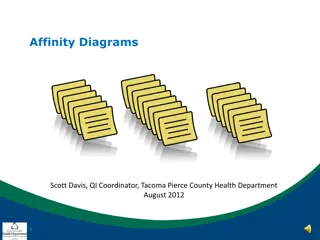
Understanding Affinity Diagrams for Effective Idea Consolidation
Affinity diagrams are a powerful tool for organizing and consolidating ideas. They help in identifying patterns, relationships, and categories among a large number of ideas. This method involves brainstorming ideas on individual sticky notes, grouping them silently, and then collaboratively naming t
0 views • 6 slides

Understanding Testing in Software Engineering
In the previous session, we discussed various aspects of software engineering, including modeling with UML diagrams, such as activity diagrams, use case diagrams, sequence diagrams, state diagrams, and class diagrams, as well as architecture patterns. Testing was emphasized as a key aspect, highligh
0 views • 35 slides

Understanding UML Activity Diagrams in Software Design
UML Activity Diagrams provide a modern way to visualize business processes, workflows, data flows, and complex algorithms in software systems. They use symbols to represent different parties involved, actions performed, transitions, and control flows. These diagrams help in modeling data flows, obje
0 views • 14 slides
Understanding Vertical Fragmentation in Distributed Information Systems
Vertical fragmentation in distributed information systems involves partitioning a relation into smaller fragments based on attributes and primary keys to improve application performance. Information requirements include attribute affinity and access frequencies, with examples of attribute usage and
0 views • 12 slides
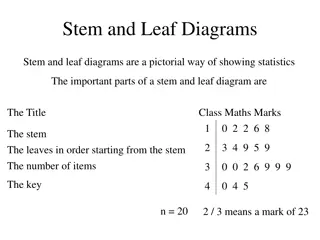
Exploring Stem and Leaf Diagrams for Statistical Analysis
Stem and leaf diagrams provide a visual way to represent statistical data effectively. This article showcases examples of stem and leaf diagrams for various datasets, including math marks, pulse rates, pocket money, speeds of cars, distances in meters, and comparison between two classes. The diagram
0 views • 6 slides
Understanding Sequence Diagrams in Software Development
Sequence diagrams depict the sequence of actions in a system, capturing the invocation of methods in objects. They are a valuable tool for representing dynamic system behavior. Message arrows in sequence diagrams indicate communications between objects, illustrating synchronous and asynchronous mess
0 views • 21 slides
Understanding Venn Diagrams and Categorical Syllogisms
Venn diagrams, introduced by John Venn, visually represent relationships between different classes. Shading in diagrams signifies empty sets or no overlap between classes. Different types of categorical statements such as universal and particular are illustrated using examples. Explore how Venn diag
0 views • 30 slides

Software Process Modeling State Diagrams Lab Exercises
Dive into the world of state diagrams and state machine diagrams in software process modeling. Explore hands-on exercises such as creating state diagrams for controlling air conditioners and garage doors. Understand the importance of capturing object states in OOP and learn how to represent transiti
0 views • 7 slides
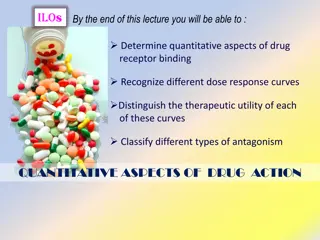
Understanding Quantitative Aspects of Drug Action
Explore the quantitative aspects of drug action, including drug receptor binding, dose-response curves, therapeutic utility, and types of antagonism. Learn about drug affinity, efficacy, potency, and the relationship between drug binding and concentration. Discover how concentration-binding curves a
0 views • 18 slides