Insights on Motorcycle Safety and Rider Behavior in NSW
This research delves into the attitudes and behaviors of motorcyclists and drivers in New South Wales regarding motorcycle safety. It reveals concerns about visibility, inattention, shared responsibility for safety, risks of alcohol and fatigue, and the impact of speed on motorcycle crashes. The findings highlight the differences between riders and drivers in perceptions and practices related to safety on the road.

Download Presentation

Please find below an Image/Link to download the presentation.
The content on the website is provided AS IS for your information and personal use only. It may not be sold, licensed, or shared on other websites without obtaining consent from the author. Download presentation by click this link. If you encounter any issues during the download, it is possible that the publisher has removed the file from their server.
E N D
Presentation Transcript
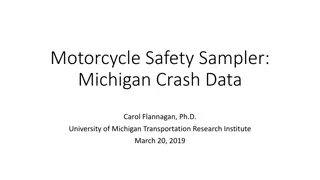
Motorcycle Attitudinal Research 22 July 2013
Aim & Sample Structure Aims of research: To explore the knowledge, attitudes and self-reported behaviour of NSW motorcyclists and drivers (regarding motorcycle safety) Previous research completed in 2002 Online survey of 3 groups: Motorcyclists from an internet panel (N=948) Motorcyclists via an open link placed on motorcycle club and association websites (N=1,036) Drivers from an internet panel (N=997)
Interactions - drivers and riders Visibility and inattention key issues One fifth of drivers said that they have concerns about sharing the road with motorcyclists (21%) Drivers concerns related to visibility and riding behaviour of motorcyclists Motorcyclists particularly concerned about their own visibility Among motorcycle riders who have crashed, many attribute cause to inattention of other road user (37%) and other road user not seeing them (27%)
Interactions - drivers and riders Common Ground Most drivers and motorcyclists thought drivers and riders shared equal responsibility for the safety of motorcycle riders but riders more likely to say that they alone were responsible for their safety (24% v 16% of drivers)
Alcohol and Fatigue Riding under the influence of alcohol and riding while fatigued were rated as high risk by riders Most riders say that they would not drink any alcohol at all before riding and that they would not start a long trip unless they were well rested Compared to riders: Drivers were more likely to agree that as long as they don t go over the legal limit, they can have alcoholic drink(s) before driving/riding (33% v 25%) Drivers were less likely than riders to agree that they never drink any alcohol at all before driving/riding (65% v 80%)
Speed Among motorcyclists who thought rider behaviour was responsible for motorcycle crashes, speeding and riding erratically or aggressively were considered key factors (34% and 25%, respectively) Over a quarter said that they exceed the speed limit every time or most times that they ride (27%) and a third said that they sometimes do (34%). Two-fifths agreed or strongly agreed that they ride faster than the speed limit when on the open road and they can see well in front of them (40%) Compared to drivers: Riders were more likely to agree that they tend to drive faster than the speed limit when they know it s unlikely they ll get caught (28% v 23%) Riders were less likely to agree that there s no such thing as safe speeding (61% v 73%)
Open link sample relative to the Representative sample
Key differences within the motorcycle sample There were key differences between the two survey samples of motorcyclists in terms of sample characteristics as well as findings relating to attitudes and behaviours Open Sample Representative sample Members of motorcycle clubs, groups or associations 43% 9% Held a motorcycle licence 98% 71% Owned a motorcycle 97% 62% Rode most commonly as a rider (as opposed to a passenger) 99% 78% Frequently rode on-road 90% 54% Experienced a crash or close call with another vehicle(s) 30% and 82% respectively 23% and 53% respectively Experienced a crash on their own 41% 32% In terms of close calls, likeliness to blame another road user 78% 62% Strongly disagreed that there's no such thing as safe speeding 27% 12% Exceeded the speed limit every time or most times they rode 49% 27%
Sample characteristics The open link sample was younger in general and a greater proportion worked full-time Smaller proportion aged 50+ years Greater proportion aged 30-49 years A greater proportion were members of motorcycle groups, clubs or associations (43% vs. 9%) More likely to have taken part in organised motorcycle tours, ride days or track days (64% vs. 33%) More likely to have attended motorcycle exhibition or events (34% vs. 12%) More likely to ride with formal or organised groups (35% vs. 16%)
Riding behaviour location Riders in the open link sample are more frequently riding on-road compared with the representative sample (90% vs. 54%) This open link sample was also more likely to: ride for over 3hrs/week (60% spent 3-10hrs/week riding) ride most often for regular commute to work or education (41% vs. 18%) ride mostly on public roads In rural areas (73% vs. 55%) In metro areas (65% vs. 50%)
Riding behaviour crashes A greater proportion of the open link sample had experienced a crash or close call: Multi-vehicle crash (30% vs. 23%) Single vehicle crash (41% vs. 32%) Close Call with another vehicle (82% vs. 53%) In terms of close calls, they were more likely to blame another road user (78% vs. 62%)
Riding behaviour - Speed Motorcyclists in the open link sample strongly disagreed that there s no such thing as safe speeding (27% vs. 12%) Half said that they exceeded the speed limit every time or most times they rode (49% vs. 27%) A greater proportion strongly agreed that they tended to: Ride on past queuing traffic (23% vs. 9%) Ride faster than the speed limit on the open road where they could see well in front of them (18% vs. 11%) Weave through lanes in order to overtake slower traffic (10% vs. 6%)
Rider perception of risk Motorcyclists in the open link sample were more likely to demonstrate a low perception of risk based on their responses to the below
Rider perception of risk There were differences in perception of risk with the open link sample: More concerned about the inattention of other drivers (43% vs. 32%) More likely to think that driving behaviour of the other motorist was the main factor in motorcycle crashes (44% vs. 37%) Less likely to think rider behaviour, such as speeding, was mainly to blame (16% vs. 28%) Where rider behaviour was involved, were more likely to think that motorcyclists riding beyond their ability was the main factor (47% vs. 20%)
Safety precautions taken The open link sample was more likely to own and/or wear at all times most items of motorcycle clothing and safety gear including: Riding gloves (88% vs. 56%) Jacket (80% vs. 45%) Full face helmet (75% vs. 50%) Boots (61% vs. 39%) Pants (47% vs. 27%) A greater proportion also owned or always wore elbow, shoulder, back knee and hip protectors
Summary The distinction between these two samples is important for communications and policy development: Representative sample based on M/C licence holders doesn t provide good insights for regular riders The open sample had much lower perception of risk, were more focussed on skills and role of other motorists in crashes Open sample wore higher levels of protective clothing Evidence of long standing attitudes since 2002
Summary comparative study A comparison between 2002 and 2012 attitude studies was undertaken The data collection methods of the surveys differed, as did the sample frames and the questionnaires. Therefore the surveys are not directly comparable and statistical significance was not tested. With consideration for the differing methodologies and sampling approaches, some of the findings suggest that: In 2012 , a greater proportion of riders admitted that they exceed the speed limit in certain situations, than in 2002 Rider perceptions of the causes of motorcycle crashes did not vary between 2002 and 2012 with the main factors deemed responsible being primarily the driving behaviour of the motorist, followed by rider inexperience and then rider behaviour Since 2002, motorcyclists may have become more likely to perceive riders riding too fast for the conditions, and riding erratically and aggressively, as responsible for crashes.