Diversity in US Census Tracts Over Decades
Explore how US Census tracts from 1990 to 2019 reflect diverse populations with no predominant racial or ethnic group exceeding 50%. Images depict the changing landscape of Asian, Black, Hispanic, and White populations in these areas.

Download Presentation

Please find below an Image/Link to download the presentation.
The content on the website is provided AS IS for your information and personal use only. It may not be sold, licensed, or shared on other websites without obtaining consent from the author. Download presentation by click this link. If you encounter any issues during the download, it is possible that the publisher has removed the file from their server.
E N D
Presentation Transcript
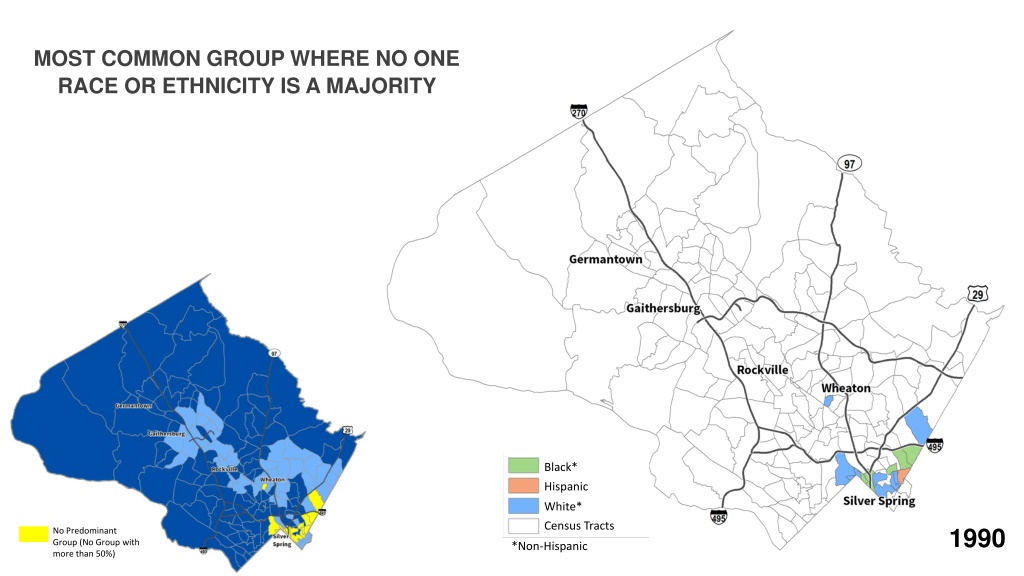
MOST COMMON GROUP WHERE NO ONE RACE OR ETHNICITY IS A MAJORITY Black* Hispanic White* Census Tracts 1990 No Predominant Group (No Group with more than 50%) *Non-Hispanic
MOST COMMON GROUP WHERE NO ONE RACE OR ETHNICITY IS A MAJORITY Asian* Black* Hispanic White* Census Tracts 2000 No Predominant Group (No Group with more than 50%) *Non-Hispanic
MOST COMMON GROUP WHERE NO ONE RACE OR ETHNICITY IS A MAJORITY Asian* Black* Hispanic White* Census Tracts 2010 No Predominant Group (No Group with more than 50%) *Non-Hispanic
MOST COMMON GROUP WHERE NO ONE RACE OR ETHNICITY IS A MAJORITY Asian* Black* Hispanic White* Census Tracts 2019 No Predominant Group (No Group with more than 50%) *Non-Hispanic