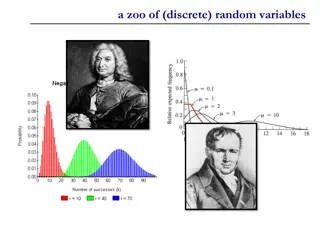
Understanding Random Variables and Expected Value in Casino Games
Explore the concept of random variables and expected value in the context of gambling, specifically in casino games like roulette. Learn about discrete versus continuous outcomes, calculate probabilities, and understand the significance of mean and standard deviation in binomial distributions. Prepare for a fun and engaging Casino Day to apply your knowledge on Thursday, 3/26.

Download Presentation

Please find below an Image/Link to download the presentation.
The content on the website is provided AS IS for your information and personal use only. It may not be sold, licensed, or shared on other websites without obtaining consent from the author. Download presentation by click this link. If you encounter any issues during the download, it is possible that the publisher has removed the file from their server.
E N D
Presentation Transcript
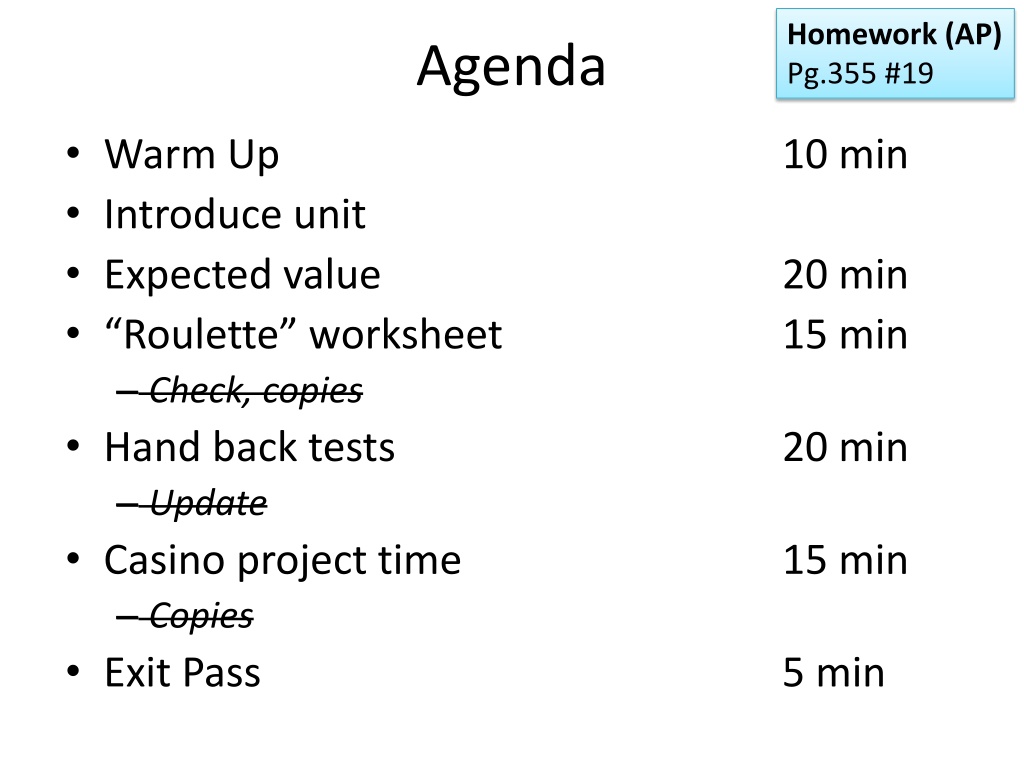
Homework (AP) Pg.355 #19 Agenda Warm Up Introduce unit Expected value Roulette worksheet Check, copies Hand back tests Update Casino project time Copies Exit Pass 10 min 20 min 15 min 20 min 15 min 5 min
These statistics are the best I could find as of 7:30pm on Sunday, March 9th, 2020. As new information becomes available, these statistics will change. Most of these numbers are from: The Epidemiological Characteristics of an Outbreak of 2019 Novel Coronavirus Diseases (COVID-19) China, 2020[J]. China CDC Weekly, 2020, 2(8): 113-122. http://weekly.chinacdc.cn/en/article/id/e53946e2-c6c4-41e9-9a9b-fea8db1a8f51 The age distribution of COV-19 cases is as follows: 80+ years old 3.2% 70-79 years old 8.8% 60-69 years old 19.2% 50-59 years old 22.4% 40-49 years old 19.2% 30-39 years old 17% 20-29 years old 8.1% 10-19 years old 1.2% 9 or younger 0.9% 81% of COV-19 cases are mild. The remaining 19% of cases are severe. 1. Let s say one of you is exposed to COV-19. What is the probability that you ll become infected with COV-19? What is the probability that you ll develop mild symptoms? Severe symptoms? Let s say one of my children (ages 4,2,0) is exposed to COV-19. What is the probability that my child will develop severe symptoms? Let s say my grandmother (87 years old) is exposed to COV-19. What is the probability that she ll develop severe symptoms? 2. 3.
The following statistics are based on the best information I could find as of 7:30pm on Sunday, March 9th, 2020. As new information becomes available, the following information may become obsolete and/or inaccurate. Most of these numbers are from: The Novel Coronavirus Pneumonia Emergency Response Epidemiology Team. The Epidemiological Characteristics of an Outbreak of 2019 Novel Coronavirus Diseases (COVID-19) China, 2020[J]. China CDC Weekly, 2020, 2(8): 113-122. (http://weekly.chinacdc.cn/en/article/id/e53946e2-c6c4-41e9-9a9b- fea8db1a8f51) The mortality rate by age for COV-19 is .: 80+ years old 14.8% 70-79 years old 8% 60-69 years old 3.6% 50-59 years old 1.3% 40-49 years old 0.4% 10-39 years old 0.2% Under 10 years old 0.0%
Unit 6 Random Variables (and gambling) Discrete vs. continuous Expected value Linear combinations Binomial probability Mean and standard deviation of binomial distributions Geometric probability Unit Test Casino Day! Thursday 3/26 Wednesday 3/25
Notes Discrete vs. Continuous 1 of 3 Discrete = countable Outcomes are isolated points on a number line Examples: Outcomes of rolling dice Number of babies born at Sutter hospital on Wednesdays Continuous = interval Outcomes are a range of values on a number line Examples: Height Weight of a tomato Time spent at In-n-Out drive-thru Classify the following as discrete or continuous: 1. Body temperature of a hospital patient. 2. Number of pages in a book. 3. Lifetime of a light-bulb. 4. Fuel efficiency of an automobile. 5. Amount of rainfall at a particular location during the next year. 6. Distance that a person throws a baseball. 7. Amount of water used by a household during a given month.
ANSWERS 1. Continuous. The body temperature of a hospital patient 2. Discrete. The number of pages in a book 3. Continuous. The lifetime of a lightbulb 4. Continuous. The fuel efficiency of an automobile 5. Continuous. The amount of rainfall at a particular location during the next year 6. Continuous. The distance that a person throws a baseball 7. Continuous. The amount of water used by a household during a given month
Notes Expected Value 2 of 3 Other names: Mean of a random variable, Weighted average Contextual definition: Expected outcome, per trial, on average, after lots of trials. Procedure Sum of the products of probability and value, for each event in the sample space. Example: You pay $1 to play. Flip 3 coins. If all are the same, you get $3! Event 0 Heads 1 Head 2 Heads 3 Heads Value ($) 2 -1 -1 2 P(X) 1/8 2 3/8 3 3/8 3 1/8 2 . 0 25 + + + = 8 8 8 8
Notes? Another example Pay $1 to play my game, roll two standard dice. If their sum is 7 or 8, double your money! (get $2) Let random variable X be the money ($) you win. Event Win: 1 Lose: -1 Value 1 -1 25 11 P(X) 36 36 . 0 389 25 11 = + 36 36
Try it! Pay $5 to play my game. Spin a wheel like this one. Yellow $1, Green $1, Blue $5, Red $10 1. Make a probability table for the possible prizes. 2. What is the expected value of the game?
Notes On the calculator 3 of 3 X in L1, P(X) in L2 Stat: Calc: 1-var stats L1,L2 x is expected value, and is standard deviation.
Notes On the calculator 3 of 3 X in L1, P(X) in L2 Stat: Calc: 1-var stats L1,L2 x is expected value, and is standard deviation. Example. I have a trick 9-sided die, meaning that it is not fair. Find the mean roll of my die, and its standard deviation, given its probability distribution below. X 1 2 3 4 5 6 7 8 9 P(X) .301 .176 .125 .097 .079 .067 .058 .051 .046
Worksheet time Assume you spend $1 to play the game.
Unit 5 Test Probability
100.00% 90.00% 80.00% 70.00% 60.00% 50.00% 40.00% 30.00% 20.00% 10.00% 0.00% P.1 P.3
Common mistakes, 1 of 4 7) People with type-O negative blood are universal donors. That is, any patient can receive a transfusion of O-negative blood. Only 7.2% of the American population has O-negative blood. If 10 people appear at random to give blood, what is the probability that at least 1 of them is a universal donor? A. 0.526 B. 0.72 C. 0.28 . 0 ( 1 D. 0 E. 1 10 928 ) 14) If A B = S (sample space), P(A and Bc) = 0.25, and P(Ac) = 0.35, then P(B) = A. 0.35 B. 0.4 C. 0.65 D. 0.75 E. Cannot be determined. A B 0.25 0.40 0.35
Common mistakes, 2 of 4 5. If P(A) = 0.24 and P(B) = 0.52 and A and B are independent, what is P(A or B)? = . 0 ( 24 . 0 )( 52 ) 1248 . A. 0.1248 A B .1248 B. 0.28 0.24 24 . 0.52 1248 . C. 0.6352 + = 52 . 6352 . D. 0.76 E. The answer cannot be determined from the information given.
Common mistakes, 3 of 4 15(a). Suppose that for a group of consumers, the probability of eating pretzels is 0.75, the probability of drinking coke is 0.65, and the probability of eating pretzels and drinking Coke is 0.55. Are these two events independent? Pretzels Coke 0.55 0.75 0.65 = = ( ) ( ) ( ) ( ) P pretzel P pretzel coke P coke P coke pretzel . 0 55 . 0 55 = . 0 65 = . 0 75 NO NO . 0 75 . 0 65
Common mistakes, 4 of 4 15b.) If four cards are drawn from a standard deck of 52 playing cards and not replaced, find the probability of getting no Hearts. 39 38 37 36 = . 0 303 52 51 50 49
Casino Project (AP) Create, mathematically analyze, and run a simple gambling game which is significantly (but not obviously) in favor of you, The House . 1-2 people (2 recommended) Up to +5% extra credit for binomial probabilities and/or confidence intervals. Monday March 9th, due end of class: 1. List three possible ideas for your project. For each game, state how to play and how to win. Wednesday March 18th (or earlier), due end of class: 2. Choose one game and give it a catchy name. Describe your game (including the title), and calculate its probabilities and expected value. Tuesday March 24th: 3. Bring an attractive poster that explains your game, including prices and prizes. Bring all components needed for your game. Thursday March 26th: CASINO DAY! 7. Run your game, attract gamblers, and help them lose their money! You must profit at least $500 ($1000 total).
Homework (AP) Pg.355 #19 Exit Pass (AP) My friend Simon is a car salesman at a dealership in Santa Cruz. He keeps track of the number of cars he sells over a long period of time, and uses the data to predict his sales and budget his family s finances. Simon gave me this distribution for his sales last Saturday. Cars sold 0 1 2 3 Probability 0.343 0.521 .110 .026 1. How many cars does Simon sell on average? 2. Do his sales vary much? How much? 3. Last Saturday Simon sold 2 cars. What is the probability that he sells at least that many this week? 4. Over a long period of time, what is the probability that Simon sells at least an average of 1.5 cars? You may assume Normality.
")


")
")