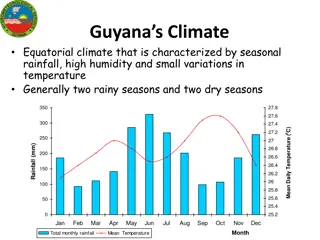
Extreme Weather Events Comparison in Different Seasons
This dataset contains detailed comparisons of extreme weather events in Spring, Summer, and Autumn for different types of convective cores and stratiform regions. The data includes information on average pixels per storm, cores per storm, and stratiform versus convective ratios across the Plains and Gulf regions. Visual representations are provided to showcase the variations in weather patterns throughout the seasons.

Download Presentation

Please find below an Image/Link to download the presentation.
The content on the website is provided AS IS for your information and personal use only. It may not be sold, licensed, or shared on other websites without obtaining consent from the author. Download presentation by click this link. If you encounter any issues during the download, it is possible that the publisher has removed the file from their server.
E N D
Presentation Transcript
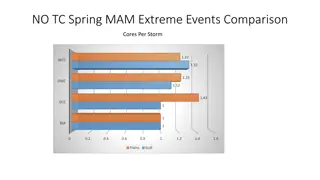
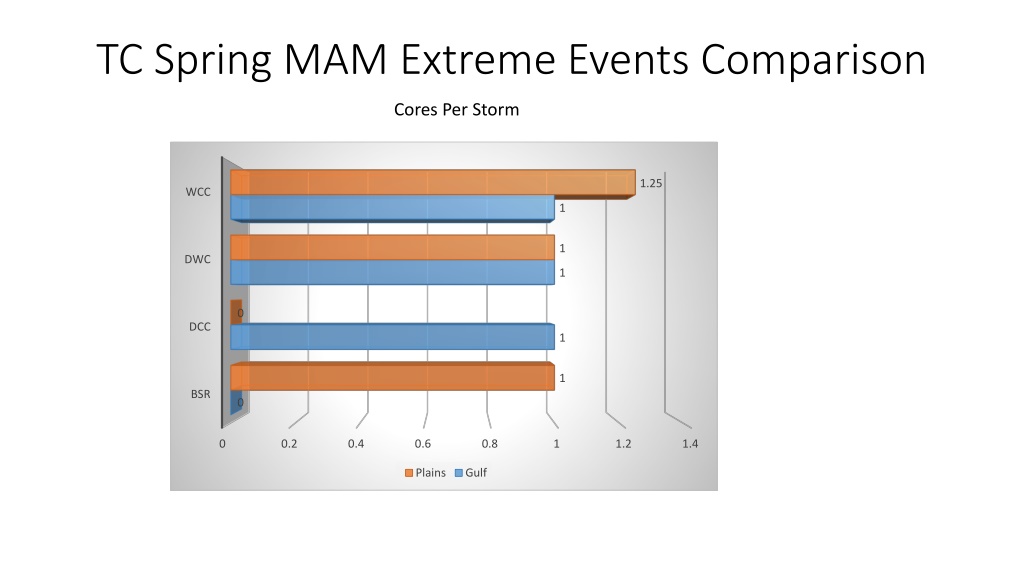
TC Spring MAM Extreme Events Comparison Cores Per Storm 1.25 WCC 1 1 DWC 1 0 DCC 1 1 BSR 0 0 0.2 0.4 0.6 0.8 1 1.2 1.4 Plains Gulf
TC Summer JJA Extreme Events Comparison Cores Per Storm WCC DWC DCC BSR 0.00 0.20 0.40 0.60 0.80 1.00 1.20 1.40 1.60 BSR 1.00 DCC 1.00 DWC 1.00 WCC 1.44 Plains Gulf 1.00 1.00 1.00 1.00
TC Autumn SON Extreme Events Comparison Cores Per Storm WCC DWC DCC BSR 0.00 0.20 0.40 0.60 0.80 1.00 1.20 1.40 BSR 1.00 DCC 1.10 DWC 1.00 WCC 1.33 Plains Gulf 1.00 1.00 0.00 1.13
TC Spring MAM Extreme Events Comparison Average Pixels Per Storm Plains Gulf Wide Convective Cores Deep Wide Convection Deep Convective Cores Broad Stratiform 0 500 1000 1500 2000 2500 3000 3500 4000 Broad Stratiform 3391 0 Deep Convective Cores 1155 2223 Deep Wide Convection 2168 589 Wide Convective Cores 2320 413 Plains Gulf
TC Summer JJA Extreme Events Comparison Average Pixels Per Storm Plains Gulf Wide Convective Cores Deep Wide Convection Deep Convective Cores Broad Stratiform 0 500 1000 1500 2000 2500 3000 3500 4000 4500 Broad Stratiform 2972 3903 Deep Convective Cores 267 463 Deep Wide Convection 4069 2263 Wide Convective Cores 2569 2956 Plains Gulf
TC Autumn SON Extreme Events Comparison Average Pixels Per Storm Plains Gulf Wide Convective Cores Deep Wide Convection Deep Convective Cores Broad Stratiform 0 500 1000 1500 2000 2500 3000 3500 4000 4500 Broad Stratiform 3359 4131 Deep Convective Cores 142 1110 Deep Wide Convection 2149 0 Wide Convective Cores 1701 1455 Plains Gulf
TC Spring MAM Extreme Events Comparison Stratiform/(Convective + Stratiform) 73.95 WCC 40.11 70.06 DWC 41.3 66.13 DCC 74.04 93.83 BSR 0 0 10 20 30 40 50 60 70 80 90 100 Plains Gulf
TC Summer JJA Extreme Events Comparison Stratiform/(Convective + Stratiform) 71.38 WCC 81.92 65.03 DWC 83.68 54.63 DCC 51.13 95.67 BSR 87.30 0.00 20.00 40.00 60.00 80.00 100.00 120.00 Plains Gulf
TC Autumn SON Extreme Events Comparison Stratiform/(Convective + Stratiform) 79.57 WCC 68.20 50.39 DWC 0.00 52.82 DCC 64.08 87.13 BSR 87.56 0.00 10.00 20.00 30.00 40.00 50.00 60.00 70.00 80.00 90.00 100.00 Plains Gulf
TC Spring MAM Extreme Events Comparison Convective/(Convective + Convective/(Convective + Stratiform Stratiform) ) 26.05 WCC 59.89 29.94 DWC 58.7 33.87 DCC 25.96 6.17 BSR 0 0 10 20 30 40 50 60 70 Plains Gulf
TC Summer JJA Extreme Events Comparison Convective/(Convective + Convective/(Convective + Stratiform Stratiform) ) 28.62 WCC 18.08 34.97 DWC 16.32 45.37 DCC 48.87 4.33 BSR 12.7 0 10 20 30 40 50 60 Plains Gulf
TC Autumn SON Extreme Events Comparison Convective/(Convective + Convective/(Convective + Stratiform Stratiform) ) 20.43 WCC 31.8 49.61 DWC 0 47.18 DCC 35.92 12.87 BSR 12.44 0 10 20 30 40 50 60 Plains Gulf
TC Spring MAM Extreme Events Comparison Convective/Stratiform Convective/Stratiform 160 149.34 140 142.11 120 100 80 60 51.22 40 42.73 35.22 35.06 20 0 6.57 0 BSR DCC DWC WCC Gulf Plains
TC Summer JJA Extreme Events Comparison Convective/Stratiform Convective/Stratiform 120 100 95.58 80 83.04 60 53.77 40 40.1 20 22.06 19.51 14.54 4.53 0 BSR DCC DWC WCC Gulf Plains
TC Autumn SON Extreme Events Comparison Convective/Stratiform Convective/Stratiform 120 100 98.44 89.33 80 60 56.05 40 46.63 20 25.67 14.77 14.21 0 0 BSR DCC DWC WCC Gulf Plains
TC Spring MAM Extreme Events Comparison Stratiform/All 90.00 80.00 70.00 60.00 50.00 40.00 30.00 20.00 10.00 0.00 BSR 0.00 82.98 DCC 40.80 33.64 DWC 16.13 45.99 WCC 18.40 52.05 Gulf Plains Gulf Plains
TC Summer JJA Extreme Events Comparison Stratiform/All 90.00 80.00 70.00 60.00 50.00 40.00 30.00 20.00 10.00 0.00 BSR 74.13 84.72 DCC 34.23 20.97 DWC 63.51 39.42 WCC 69.13 50.74 Gulf Plains Gulf Plains
TC Autumn SON Extreme Events Comparison Stratiform/All 90.00 80.00 70.00 60.00 50.00 40.00 30.00 20.00 10.00 0.00 BSR 80.18 79.85 DCC 42.43 26.50 DWC 0.00 29.83 WCC 56.63 67.27 Gulf Plains Gulf Plains
TC Spring MAM Extreme Events Comparison Convection/All 18.33 WCC 27.48 19.65 DWC 22.92 17.23 DCC 14.30 5.46 BSR 0.00 0.00 5.00 10.00 15.00 20.00 25.00 30.00 Plains Gulf BSR % Difference: -158.81 , DCC % Difference: 14.85 , DWC % Difference: -4.62, WCC % Difference: -4.72
TC Summer JJA Extreme Events Comparison Convection/All 20.35 WCC 15.25 21.20 DWC 12.39 17.42 DCC 32.72 3.84 BSR 10.78 0.00 5.00 10.00 15.00 20.00 25.00 30.00 35.00 Plains Gulf
TC Autumn SON Extreme Events Comparison Convection/All 17.27 WCC 26.41 29.36 DWC 0.00 23.67 DCC 23.78 11.79 BSR 11.39 0.00 5.00 10.00 15.00 20.00 25.00 30.00 Plains Gulf
TC Spring MAM Extreme Events Comparison (C + SF) / ALL 90.00 80.00 70.00 60.00 50.00 40.00 30.00 20.00 10.00 0.00 BSR DCC DWC WCC BSR 0.00 88.44 DCC 55.11 50.87 DWC 39.05 65.64 WCC 45.88 70.38 Gulf Plains Gulf Plains
TC Summer JJA Extreme Events Comparison (C + SF) / ALL 90.00 80.00 70.00 60.00 50.00 40.00 30.00 20.00 10.00 0.00 BSR DCC DWC WCC BSR 84.91 88.56 DCC 66.95 38.39 DWC 75.90 60.62 WCC 84.38 71.09 Gulf Plains Gulf Plains
TC Autumn SON Extreme Events Comparison (C + SF)/ALL 100.00 90.00 80.00 70.00 60.00 50.00 40.00 30.00 20.00 10.00 0.00 BSR DCC DWC WCC BSR 91.57 91.63 DCC 66.22 50.18 DWC 0.00 59.19 WCC 83.04 84.54 Gulf Plains Gulf Plains
TC Spring MAM Extreme Events Comparison Average Pixels Per Core 120.00 100.00 80.00 60.00 40.00 20.00 0.00 DCC DWC WCC Gulf Plains
TC Summer JJA Extreme Events Comparison Average Pixels Per Core 500.00 400.00 300.00 200.00 100.00 0.00 DCC DWC WCC Gulf Plains
TC Autumn SON Extreme Events Comparison Average Pixels Per Core 500.00 400.00 300.00 200.00 100.00 0.00 DCC DWC WCC Gulf Plains
TC Spring MAM Extreme Events Comparison NUMBER OF CORES Gulf Plains 6 5 4 3 2 1 0 Broad Stratiform Deep Convective Core Deep Wide Core Wide Convective Core
TC Summer JJA Extreme Events Comparison NUMBER OF CORES Gulf Plains 10 9 8 7 6 5 4 3 2 1 0 Broad Stratiform Deep Convective Core Deep Wide Core Wide Convective Core
TC Autumn SON Extreme Events Comparison NUMBER OF CORES Gulf Plains 10 9 8 7 6 5 4 3 2 1 0 Broad Stratiform Deep Convective Core Deep Wide Core Wide Convective Core