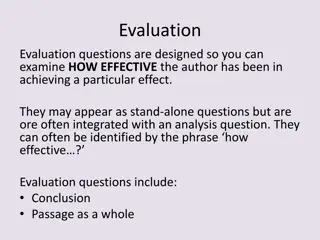
Evaluation Methods and Challenges in Project Analysis
Examining the course provided by Shawn Cole from Harvard Business School, this content covers topics such as evaluation techniques, randomized sampling, threats in analysis, and project analysis from start to finish. It delves into key concepts like attrition, spillovers, compliance, and bias in sampling, highlighting the importance of understanding and addressing these issues for accurate project evaluation.

Download Presentation

Please find below an Image/Link to download the presentation.
The content on the website is provided AS IS for your information and personal use only. It may not be sold, licensed, or shared on other websites without obtaining consent from the author. Download presentation by click this link. If you encounter any issues during the download, it is possible that the publisher has removed the file from their server.
E N D
Presentation Transcript
Threats and Analysis Shawn Cole Harvard Business School
Course Overview What is Evaluation? Measuring Impacts Why Randomize? How to Randomize Sampling and Sample Size Threats and Analysis Project from Start to Finish
Course Overview What is Evaluation? Measuring Impacts Why Randomize? How to Randomize Sampling and Sample Size Threats and Analysis Project from Start to Finish
Lecture Overview Attrition Spillovers Partial Compliance and Sample Selection Bias Intention to Treat & Treatment on Treated Choice of outcomes External validity Cost Effectiveness
Lecture Overview Attrition Spillovers Partial Compliance and Sample Selection Bias Intention to Treat & Treatment on Treated Choice of outcomes External validity Cost Effectiveness
Attrition Is it a problem if some of the people in the experiment vanish before you collect your data? It is a problem if the type of people who disappear is correlated with the treatment. Why is it a problem? Why should we expect this to happen?
Attrition bias: an example The problem you want to address: Some children don t come to school because they are too weak (undernourished) You start a school feeding program and want to do an evaluation You have a treatment and a control group Weak, stunted children start going to school more if they live next to a treatment school First impact of your program: increased enrollment. In addition, you want to measure the impact on child s growth Second outcome of interest: Weight of children You go to all the schools (treatment and control) and measure everyone who is in school on a given day Will the treatment-control difference in weight be over- stated or understated?
Before Treatment After Treament T C T C 20 25 30 20 25 30 20 25 30 22 27 32 Ave. Difference Difference
Before Treatment After Treament T C T C 20 25 30 20 25 30 20 25 30 22 27 32 Ave. 25 25 27 25 Difference 0 Difference 2
What if only children > 21 Kg come to school? Before Treatment After Treament T C T C 52% 20 25 30 20 25 30 20 25 30 22 27 32 A. Will you underestimate the impact? B. Will you overestimate the impact? C. Neither D. Ambiguous E. Don t know 19% 10% 10% 10% A. B. C. D. E.
What if only children > 21 Kg come to school? Before Treatment T After Treament T C C [absent] 25 30 [absent] 25 30 [absent] 25 30 22 27 32 Ave. 27.5 27.5 27 27.5 Difference 0 Difference -0.5
When is attrition not a problem? A. When it is less than 25% of the original sample B. When it happens in the same proportion in both groups C. When it is correlated with treatment assignment D. All of the above E. None of the above 40% 35% 25% 0% 0% A. B. C. D. E.
When is attrition not a problem? A. When it is less than 25% of the original sample B. When it happens in the same proportion in both groups C. When it is correlated with treatment assignment D. All of the above E. None of the above 83% 9% 9% 0% 0% A. B. C. D. E.
Attrition Bias Devote resources to tracking participants after they leave the program If there is still attrition, check that it is not different in treatment and control. Is that enough? Also check that it is not correlated with observables. Try to bound the extent of the bias suppose everyone who dropped out from the treatment got the lowest score that anyone got; suppose everyone who dropped out of control got the highest score that anyone got Why does this help?
Lecture Overview Attrition Spillovers Partial Compliance and Sample Selection Bias Intention to Treat & Treatment on Treated Choice of outcomes External validity Cost Effectiveness
What else could go wrong? Not in evaluation Target Target Population Population Total Total Population Population Treatment Group Evaluation Sample Random Assignment Control Group
Spillovers, contamination Not in evaluation Target Target Population Population Total Total Population Population Treatment Treatment Group Evaluation Sample Random Assignment Control Group
Spillovers, contamination Not in evaluation Target Target Population Population Total Total Population Population Treatment Treatment Group Evaluation Sample Random Assignment Control Group
Example: Vaccination for chicken pox Suppose you randomize chicken pox vaccinations within schools Suppose that prevents the transmission of disease, what problems does this create for evaluation? Suppose externalities are local? How can we measure total impact?
Externalities Within School Without Externalities Treated? Yes No Yes No Yes No School A Pupil 1 Pupil 2 Pupil 3 Pupil 4 Pupil 5 Pupil 6 Outcome no chicken pox chicken pox no chicken pox chicken pox no chicken pox chicken pox Total in Treatment with chicken pox Total in Control with chicken pox Treament Effect With Externalities Suppose, because prevalence is lower, some children are not re-infected with chicken pox School A Pupil 1 Pupil 2 Pupil 3 Pupil 4 Pupil 5 Pupil 6 Treated? Yes No Yes No Yes No Outcome no chicken pox no chicken pox no chicken pox chicken pox no chicken pox chicken pox Total in Treatment with chicken pox Total in Control with chicken pox Treatment Effect
Externalities Within School Without Externalities Treated? Yes No Yes No Yes No School A Pupil 1 Pupil 2 Pupil 3 Pupil 4 Pupil 5 Pupil 6 Outcome no chicken pox chicken pox no chicken pox chicken pox no chicken pox chicken pox Total in Treatment with chicken pox Total in Control with chicken pox 0% 100% Treament Effect -100% With Externalities Suppose, because prevalence is lower, some children are not re-infected with chicken pox School A Pupil 1 Pupil 2 Pupil 3 Pupil 4 Pupil 5 Pupil 6 Treated? Yes No Yes No Yes No Outcome no chicken pox no chicken pox no chicken pox chicken pox no chicken pox chicken pox Total in Treatment with chicken pox Total in Control with chicken pox 0% 67% Treatment Effect -67%
How to measure program impact in the presence of spillovers? Design the unit of randomization so that it encompasses the spillovers If we expect externalities that are all within school: Randomization at the level of the school allows for estimation of the overall effect
Example: Price Information Providing farmers with spot and futures price information by mobile phone Should we expect spilloves? Randomize: individual or village level? Village level randomization Less statistical power Purer control groups Individual level randomization More statistical power (if spillovers small) Ability to measure spillovers
Example: Price Information Can we do both? Randomly assign villages into one of four groups, A, B, C, and D Group A Villages SMS price information to all individuals with phones Group B Villages SMS price information to randomly selected 75% of individuals with phones Group C Villages SMS price information to randomly selected 25% of individuals with phones Group D Villages No SMS price information
Lecture Overview Attrition Spillovers Partial Compliance and Sample Selection Bias Intention to Treat & Treatment on Treated Choice of outcomes External validity Cost Effectiveness
Non compliers What can you do? Can you switch them? Not in evaluation No! Target Target Population Population Participants Treatment group Evaluation Sample Random Assignment No-Shows Non- Control group Participants Cross-overs 27
Non compliers What can you do? Can you drop them? Not in evaluation No! Target Target Population Population Participants Treatment group Evaluation Sample Random Assignment No-Shows Non- Control group Participants Cross-overs 28
Non compliers Not in evaluation You can compare the original groups Target Target Population Population Participants Treatment group Evaluation Sample Random Assignment No-Shows Non- Control group Participants Cross-overs 29
Sample selection bias Sample selection bias could arise if factors other than random assignment influence program allocation Even if intended allocation of program was random, the actual allocation may not be
Sample selection bias Individuals assigned to comparison group could attempt to move into treatment group School feeding program: parents could attempt to move their children from comparison school to treatment school Alternatively, individuals allocated to treatment group may not receive treatment School feeding program: some students assigned to treatment schools bring and eat their own lunch anyway, or choose not to eat at all.
Lecture Overview Attrition Spillovers Partial Compliance and Sample Selection Bias Intention to Treat & Treatment on Treated Choice of outcomes External validity Cost Effectiveness
ITT and ToT Vaccination campaign in villages Some people in treatment villages not treated 78% of people assigned to receive treatment received some treatment What do you do? Compare the beneficiaries and non-beneficiaries? Why not?
Which groups can be compared ? Treatment Group: Control Group Vaccination Acceptent : TREATED NON-TREATED Refusent : NON-TREATED
What is the difference between the 2 random groups? Treatment Group Control Group 1: treated not infected 2: treated not infected 3: treated infected 5: non-treated infected 6: non-treated not infected 7: non-treated infected 8: non-treated infected 4: non-treated infected
Intention to Treat - ITT Treatment Group: Control Group: 50% infected 75% infected Y(T)= Average Outcome in Treatment Group Y(C)= Average Outcome in Control Group ITT = Y(T) - Y(C) ITT = 50% - 75% = -25 percentage points
Intention to Treat (ITT) What does intention to treat measure? What happened to the average child who is in a treated school in this population? Is this difference the causal effect of the intervention?
When is ITT useful? May relate more to actual programs For example, we may not be interested in the medical effect of deworming treatment, but what would happen under an actual deworming program. If students often miss school and therefore don't get the deworming medicine, the intention to treat estimate may actually be most relevant.
What NOT to do! What NOT to do! Observed Change in weight Intention to Treat ? yes yes yes yes yes yes yes yes yes yes Avg. Change among Treated A= School 1 Treated? yes yes yes no yes no no yes yes no Pupil 1 Pupil 2 Pupil 3 Pupil 4 Pupil 5 Pupil 6 Pupil 7 Pupil 8 Pupil 9 Pupil 10 4 4 4 0 4 2 0 6 6 0 School 1: Avg. Change among Treated School 2: Avg. Change among not-treated (A) (B) A-B School 2 Pupil 1 Pupil 2 Pupil 3 Pupil 4 Pupil 5 Pupil 6 Pupil 7 Pupil 8 Pupil 9 Pupil 10 Avg. Change among Not-Treated B= no no no no no no no no no no no no yes no no yes no no no no 2 1 3 0 0 3 0 0 0 0
What NOT to do! What NOT to do! Observed Change in weight Intention to Treat ? yes yes yes yes yes yes yes yes yes yes Avg. Change among Treated A= School 1 Treated? yes yes yes no yes no no yes yes no Pupil 1 Pupil 2 Pupil 3 Pupil 4 Pupil 5 Pupil 6 Pupil 7 Pupil 8 Pupil 9 Pupil 10 4 4 4 0 4 2 0 6 6 0 School 1: Avg. Change among Treated School 2: Avg. Change among not-treated (A) 3 (B) 3 0.9 A-B School 2 2.1 Pupil 1 Pupil 2 Pupil 3 Pupil 4 Pupil 5 Pupil 6 Pupil 7 Pupil 8 Pupil 9 Pupil 10 Avg. Change among Not-Treated B= no no no no no no no no no no no no yes no no yes no no no no 2 1 3 0 0 3 0 0 0 0 0.9
From ITT to effect of treatment on the treated (TOT) The point is that if there is leakage across the groups, the comparison between those originally assigned to treatment and those originally assigned to control is smaller But the difference in the probability of getting treated is also smaller Formally this is done by instrumenting the probability of treatment by the original assignment 41
Estimating ToT from ITT: Wald 1.2 1 Actually Treated 0.8 0.6 0.4 0.2 0 Treatment Control
Interpreting ToT from ITT: Wald 1.2 1 Actually Treated 0.8 0.6 0.4 0.2 0 Treatment Control
Estimating TOT What values do we need? Y(T) Y(C) Prob[treated|T] Prob[treated|C]
Treatment on the treated (TOT) Starting from a simple regression model: ??= ? + ? ??+ ?? [Angrist and Pischke, p. 67 show]: ? =? ????= 1 ? ????= 0 ? ????= 1 ? ????= 0
Treatment on the treated (TOT) ? =? ????= 1 ? ????= 0 ? ????= 1 ? ????= 0 ? ? ? ? ???? ??????? ? ????[???????|?]
TOT estimator Observed Change in weight Intention to Treat ? yes yes yes yes yes yes yes yes yes yes School 1 Treated? yes yes yes no yes no no yes yes no Pupil 1 Pupil 2 Pupil 3 Pupil 4 Pupil 5 Pupil 6 Pupil 7 Pupil 8 Pupil 9 Pupil 10 4 4 4 0 4 2 0 6 6 0 A = Gain if Treated B = Gain if not Treated ToT Estimator: A-B Y(T)-Y(C) A-B = Prob(Treated|T)-Prob(Treated|C) Avg. Change Y(T)= School 2 Pupil 1 Pupil 2 Pupil 3 Pupil 4 Pupil 5 Pupil 6 Pupil 7 Pupil 8 Pupil 9 Pupil 10 no no no no no no no no no no no no yes no no yes no no no no 2 1 3 0 0 3 0 0 0 0 Y(T) Y(C) Prob(Treated|T) Prob(Treated|C) Y(T)-Y(C) Prob(Treated|T)-Prob(Treated|C) Avg. Change Y(C) = A-B
TOT estimator Observed Change in weight Intention to Treat ? yes yes yes yes yes yes yes yes yes yes School 1 Treated? yes yes yes no yes no no yes yes no Pupil 1 Pupil 2 Pupil 3 Pupil 4 Pupil 5 Pupil 6 Pupil 7 Pupil 8 Pupil 9 Pupil 10 4 4 4 0 4 2 0 6 6 0 A = Gain if Treated B = Gain if not Treated ToT Estimator: A-B A-B = Y(T)-Y(C) Avg. Change Y(T)= Prob(Treated|T)-Prob(Treated|C) 3 School 2 Pupil 1 Pupil 2 Pupil 3 Pupil 4 Pupil 5 Pupil 6 Pupil 7 Pupil 8 Pupil 9 Pupil 10 no no no no no no no no no no no no yes no no yes no no no no 2 1 3 0 0 3 0 0 0 0 Y(T) Y(C) Prob(Treated|T) Prob(Treated|C) 3 0.9 60% 20% Y(T)-Y(C) Prob(Treated|T)-Prob(Treated|C) 2.1 40% Avg. Change Y(C) = A-B 0.9 5.25
Generalizing the ToT Approach: Instrumental Variables 1. First stage regression: ???????= ??+ ???+ ????+ ? 2. Predict treatment status using estimated coefficients ??????????= ??+ ????+ ???? 3. Regress outcome variable on predicted treatment status ??= ??+ ?? ??????????+ ????+ ? 4. ??gives treatment effect
Requirements for Instrumental Variables First stage Your experiment (or instrument) meaningfully affects probability of treatment Exclusion restriction Your expeirment (or instrument) does not affect outcomes through another channel


")


")
")