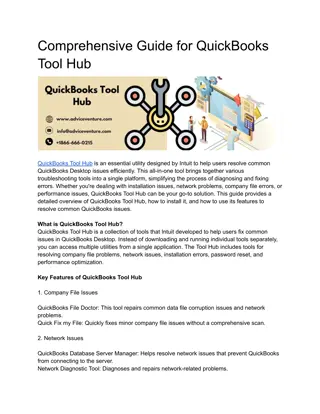
BMC's QI Hub: Your Quality Improvement Resource


BMC’s QI Hub is your resource for all things quality improvement.
Visit
bucme.org/BMCQIHUB
or email
QIHub@bmc.org
for access to professional coaching,
educational tools, support, mentorship, and much more!


R
u
n
C
h
a
r
t
s
a
n
d
U
n
d
e
r
s
t
a
n
d
i
n
g
V
a
r
i
a
t
i
o
n
Leading Change Collaborative
Learning Block 3 – 12/13/2021
D
i
s
c
l
o
s
u
r
e
•
Natalie Sanfratello, MPH has no relevant financial relationships to
disclose
L
e
a
r
n
i
n
g
O
b
j
e
c
t
i
v
e
s
•
Explain the key elements of a run chart
•
Discuss the advantages of tracking data over time vs pre-
post data
•
Distinguish between common cause and special cause
variation.
H
o
w
d
o
w
e
k
n
o
w
i
f
a
n
i
n
t
e
r
v
e
n
t
i
o
n
i
s
l
e
a
d
i
n
g
t
o
a
c
h
a
n
g
e
?
Run charts help you to:
•
Learn about the system you are trying to improve at
baseline
•
Make a judgment about whether the interventions are
leading to a change
•
Determine if your improvement has been sustained
B
u
i
l
d
i
n
g
a
R
u
n
C
h
a
r
t
R
u
n
C
h
a
r
t
S
a
m
p
l
e
H
o
w
t
o
s
t
a
r
t
•
Obtain your baseline data!
•
Label your chart!
•
X-axis – Most likely will be time, but could be occurrences, patients, or
events. Include room for future events/time. Label!
•
Y-axis – Create a logical scale for the y-axis based on your baseline
data. The data should mostly reside in the middle of the scale to allow
space to plot future data points. Label!
•
Plot your data points.
•
Calculate a median (you must have at least 10 data points to calculate
the median). Place median line on your chart.
•
Place a goal/target line (optional)
•
ANNOTATE AS YOU GO!
The Health Care Data Guide (p70)
W
h
y
t
r
a
c
k
d
a
t
a
o
v
e
r
t
i
m
e
i
n
Q
I
p
r
o
j
e
c
t
s
?
D
a
t
a
O
v
e
r
T
i
m
e
v
s
P
r
e
-
P
o
s
t
D
a
t
a
Dr. Miller is the Medical Director of a small private practice in Dorchester.
He received complaints that his office was taking too long to call patients
back.
He then started a QI project to reduce the delay times in patient callbacks.
His office created a process map, key driver diagram and came up with
key areas in the process to change.
They make the change, and then gathered to discuss their data…
D
a
t
a
O
v
e
r
T
i
m
e
v
s
P
r
e
-
P
o
s
t
D
a
t
a
•
Scenario #1: Data is taken once before and once after the change was
made.
•
Did the change lead to improvement?
The Improvement Guide (p149)
D
a
t
a
O
v
e
r
T
i
m
e
v
s
P
r
e
-
P
o
s
t
D
a
t
a
•
Scenario #1: Data is taken once before and once after the change was
made.
•
Did the change lead to improvement?
Yes! Wait … No, Maybe?
The Improvement Guide (p149)
D
a
t
a
O
v
e
r
T
i
m
e
v
s
P
r
e
-
P
o
s
t
D
a
t
a
•
Scenario #2: Data is taken incrementally over time throughout the
project
•
D
i
d
t
h
e
c
h
a
n
g
e
l
e
a
d
t
o
i
m
p
r
o
v
e
m
e
n
t
?
The Improvement Guide (p149)
D
a
t
a
O
v
e
r
T
i
m
e
v
s
P
r
e
-
P
o
s
t
D
a
t
a
•
Scenario #2: Data is taken incrementally over time throughout the
project
•
D
i
d
t
h
e
c
h
a
n
g
e
l
e
a
d
t
o
i
m
p
r
o
v
e
m
e
n
t
?
Y
e
s
!
The Improvement Guide (p149)
D
a
t
a
O
v
e
r
T
i
m
e
v
s
P
r
e
-
P
o
s
t
D
a
t
a
•
What else could this data be representative of?
•
Why was it difficult to answer whether the change led to improvement?
Did the change lead to improvement?
The Improvement Guide (p150)
Random Variation
C
h
a
n
g
e
d
i
d
n
o
t
h
o
l
d
Did the change lead to improvement? NO!
The Improvement Guide (p150)
Random Variation
Headed down before the change
C
h
a
n
g
e
d
i
d
n
o
t
h
o
l
d
Did the change lead to improvement? NO!
The Improvement Guide (p150)
Random Variation
Headed down before the change
C
h
a
n
g
e
d
i
d
n
o
t
h
o
l
d
Improvement occurred before the change
(Week 5)
Did the change lead to improvement? NO!
The Improvement Guide (p150)
Random Variation
Headed down before the change
C
h
a
n
g
e
d
i
d
n
o
t
h
o
l
d
Improvement occurred before the change
(Week 5)
Week 4 was not typical of the process.
Did the change lead to improvement? NO!
The Improvement Guide (p150)
W
h
y
v
i
e
w
d
a
t
a
o
v
e
r
t
i
m
e
?
•
There will be variation due to causes unrelated to the
change being tested
•
The effect of the change must be distinguished from
these variations
•
Viewing the pattern of the data over time can assist in
this distinction
U
n
d
e
r
s
t
a
n
d
i
n
g
V
a
r
i
a
t
i
o
n
R
u
n
c
h
a
r
t
s
h
e
l
p
u
s
u
n
d
e
r
s
t
a
n
d
t
h
e
t
y
p
e
o
f
v
a
r
i
a
t
i
o
n
p
r
e
s
e
n
t
i
n
o
u
r
d
a
t
a
Time
Data
Median
Time
Data
Median
4
R
u
l
e
s
o
f
N
o
n
r
a
n
d
o
m
S
i
g
n
a
l
s
o
f
C
h
a
n
g
e
•
Rule #1 – Shift
•
6 or more consecutive points either all above or all below the median
•
A point that falls on the median doesn’t add to or break a shift
Perla et al, 2011
4
R
u
l
e
s
o
f
N
o
n
r
a
n
d
o
m
S
i
g
n
a
l
s
o
f
C
h
a
n
g
e
•
Rule #2 – Trend
•
5 or more consecutive points all going up or all going down
•
Consecutive points being the same do not make or break a trend
Perla et al, 2011
4
R
u
l
e
s
o
f
N
o
n
r
a
n
d
o
m
S
i
g
n
a
l
s
o
f
C
h
a
n
g
e
•
Rule #3 – Runs
•
Too few or too many runs (a series of points on one side of the
median line) crossing the Median line
•
If the data line did not cross the median, a new run has not begun
Perla et al, 2011
4
R
u
l
e
s
o
f
N
o
n
r
a
n
d
o
m
S
i
g
n
a
l
s
o
f
C
h
a
n
g
e
–
3
c
t
d
.
Nat Evans on Slideshare - Community Engagement at Process Excellence
Network (PEX Network - a division of IQPC):
https://www.slideshare.net/PEXNetwork_team/run-charts-14786427
4
R
u
l
e
s
o
f
N
o
n
r
a
n
d
o
m
S
i
g
n
a
l
s
o
f
C
h
a
n
g
e
–
3
c
t
d
.
Too many or too few runs can indicate the data needs to be
stratified into sub-groups; you may be observing differences
between a night shift and a day shift, for example.
Stratifying may also help to identify disparities based on certain
demographic factors.
Graphing the data on two separate run charts will help you
understand each sub-group better.
W
h
e
n
w
e
d
i
s
a
g
g
r
e
g
a
t
e
t
h
e
d
a
t
a
,
w
e
m
a
y
b
e
c
o
m
e
m
o
r
e
k
n
o
w
l
e
d
g
e
a
b
l
e
a
b
o
u
t
w
h
a
t
P
D
S
A
s
m
a
y
m
a
k
e
a
d
i
f
f
e
r
e
n
c
e
4
R
u
l
e
s
o
f
N
o
n
r
a
n
d
o
m
S
i
g
n
a
l
s
o
f
C
h
a
n
g
e
•
Rule #4 – Astronomical Point
•
An obviously and blatantly different value.
•
Anyone studying the chart would agree that it is highly unusual.
Rocco et al, 2011
U
n
d
e
r
s
t
a
n
d
i
n
g
V
a
r
i
a
t
i
o
n
•
Since we are implementing changes in a real-world
setting, there will be variation in the measure of the
product or process due to causes unrelated to the
change being tested
•
The effect of the change must be distinguished from
these unrelated variations
U
n
d
e
r
s
t
a
n
d
i
n
g
V
a
r
i
a
t
i
o
n
•
Common Cause Variations
•
“Causes that are inherent in the system (process or
product) over time, affecting everyone working in the
system, and affecting all outcomes of the system”
•
A system that ONLY common cause variations affect
the outcome is called a
stable system
•
Special Cause Variations
The Healthcare Data Guide, p108
U
n
d
e
r
s
t
a
n
d
i
n
g
V
a
r
i
a
t
i
o
n
•
Common Cause Variations
•
Special Cause Variations
•
“Causes that are not part of the system (process or
product) all the time or do not affect everyone, but arise
because of specific circumstances.”
•
A system that contains both common and special cause
variations that affect the outcomes is called an
unstable
system.
The Healthcare Data Guide, p108
C
o
m
m
o
n
m
i
s
t
a
k
e
s
m
a
d
e
w
i
t
h
v
a
r
i
a
t
i
o
n
s
•
Common Cause Variations
•
Treating common cause variation as if it was a special
cause variation.
Will cause one to adjust the system when the only way to
improve the system is by fundamentally changing it.
•
Special Cause Variations
•
Accepting special cause variation as if it was a common
cause variation.
Will cause one to miss an opportunity to fix a problem.
The Healthcare Data Guide, p108
H
o
w
t
o
R
e
s
p
o
n
d
t
o
V
a
r
i
a
t
i
o
n
H
o
w
t
o
R
e
s
p
o
n
d
t
o
V
a
r
i
a
t
i
o
n
(
C
o
n
t
r
o
l
C
h
a
r
t
)
C
u
r
r
e
n
t
S
t
a
t
e
Unstable process
Special cause present
Process average is high
A
c
t
i
o
n
R
e
q
u
i
r
e
d
Identify and eliminate bad special
causes
Identify and build in good special
causes
Source: Handbook for Improvement
—
A Reference Guide for Tools and Concepts Healthcare
Management Directories, Inc. 2002
H
o
w
t
o
R
e
s
p
o
n
d
t
o
V
a
r
i
a
t
i
o
n
(
C
o
n
t
r
o
l
C
h
a
r
t
)
C
u
r
r
e
n
t
S
t
a
t
e
Stable process
Common cause variation has been
reduced
Process average is too high
A
c
t
i
o
n
R
e
q
u
i
r
e
d
Take action to move the average of
the process down – create a
special cause variation within the
system to fundamentally change it
Source: Handbook for Improvement
—
A Reference Guide for Tools and Concepts Healthcare
Management Directories, Inc. 2002
Q
u
e
s
t
i
o
n
s
/
C
o
m
m
e
n
t
s
?

BMC's QI Hub offers professional coaching, educational tools, support, mentorship, and more for quality improvement. Learn about run charts, understanding variation, tracking data over time, and distinguishing between common cause and special cause variation. Discover how run charts help assess interventions and improvements. Get insights on building a run chart, obtaining baseline data, and tracking progress in QI projects. Explore the benefits and methods of data tracking over time in quality improvement endeavors.

Download Presentation

Please find below an Image/Link to download the presentation.
The content on the website is provided AS IS for your information and personal use only. It may not be sold, licensed, or shared on other websites without obtaining consent from the author. Download presentation by click this link. If you encounter any issues during the download, it is possible that the publisher has removed the file from their server.
E N D
Presentation Transcript
BMCs QI Hub is your resource for all things quality improvement. Visit bucme.org/BMCQIHUB or email QIHub@bmc.org for access to professional coaching, educational tools, support, mentorship, and much more!
Run Charts and Understanding Variation Leading Change Collaborative Learning Block 3 12/13/2021
Disclosure Natalie Sanfratello, MPH has no relevant financial relationships to disclose
Learning Objectives Explain the key elements of a run chart Discuss the advantages of tracking data over time vs pre- post data Distinguish between common cause and special cause variation.
How do we know if an intervention is leading to a change? Run charts help you to: Learn about the system you are trying to improve at baseline Make a judgment about whether the interventions are leading to a change Determine if your improvement has been sustained
Run Chart Sample Average Wait Times by Week 90 80 70 60 50 40 30 20 10 0 1 2 3 4 5 6 7 8 9 10 11 12 13 14 15 16 17 18 19 20 Average Wait time (minutes) Baseline Median Goal
How to start Obtain your baseline data! Label your chart! X-axis Most likely will be time, but could be occurrences, patients, or events. Include room for future events/time. Label! Y-axis Create a logical scale for the y-axis based on your baseline data. The data should mostly reside in the middle of the scale to allow space to plot future data points. Label! Plot your data points. Calculate a median (you must have at least 10 data points to calculate the median). Place median line on your chart. Place a goal/target line (optional) ANNOTATE AS YOU GO! The Health Care Data Guide (p70)
Data Over Time vs Pre-Post Data Dr. Miller is the Medical Director of a small private practice in Dorchester. He received complaints that his office was taking too long to call patients back. He then started a QI project to reduce the delay times in patient callbacks. His office created a process map, key driver diagram and came up with key areas in the process to change. They make the change, and then gathered to discuss their data
Data Over Time vs Pre-Post Data Scenario #1: Data is taken once before and once after the change was made. Did the change lead to improvement? The Improvement Guide (p149)
Data Over Time vs Pre-Post Data Scenario #1: Data is taken once before and once after the change was made. Did the change lead to improvement? Yes! Wait No, Maybe? The Improvement Guide (p149)
Data Over Time vs Pre-Post Data Scenario #2: Data is taken incrementally over time throughout the project Did the change lead to improvement? The Improvement Guide (p149)
Data Over Time vs Pre-Post Data Scenario #2: Data is taken incrementally over time throughout the project Did the change lead to improvement? Yes! The Improvement Guide (p149)
Data Over Time vs Pre-Post Data What else could this data be representative of? Why was it difficult to answer whether the change led to improvement?
Did the change lead to improvement? The Improvement Guide (p150)
Random Variation Change did not hold Change did not hold Did the change lead to improvement? NO! The Improvement Guide (p150)
Random Variation Headed down before the change Change did not hold Change did not hold Did the change lead to improvement? NO! The Improvement Guide (p150)
Random Variation Headed down before the change Change did not hold Change did not hold Did the change lead to improvement? NO! Improvement occurred before the change (Week 5) The Improvement Guide (p150)
Random Variation Headed down before the change Change did not hold Change did not hold Did the change lead to improvement? NO! Improvement occurred before the change (Week 5) Week 4 was not typical of the process. The Improvement Guide (p150)
Why view data over time? There will be variation due to causes unrelated to the change being tested The effect of the change must be distinguished from these variations Viewing the pattern of the data over time can assist in this distinction
Run charts help us understand the type of variation present in our data Median Data Time Intervention Median Data Time
4 Rules of Nonrandom Signals of Change Rule #1 Shift 6 or more consecutive points either all above or all below the median A point that falls on the median doesn t add to or break a shift Perla et al, 2011
4 Rules of Nonrandom Signals of Change Rule #2 Trend 5 or more consecutive points all going up or all going down Consecutive points being the same do not make or break a trend Perla et al, 2011
4 Rules of Nonrandom Signals of Change Rule #3 Runs Too few or too many runs (a series of points on one side of the median line) crossing the Median line If the data line did not cross the median, a new run has not begun Perla et al, 2011
4 Rules of Nonrandom Signals of Change 3 ctd. Nat Evans on Slideshare - Community Engagement at Process Excellence Network (PEX Network - a division of IQPC): https://www.slideshare.net/PEXNetwork_team/run-charts-14786427
4 Rules of Nonrandom Signals of Change 3 ctd. Too many or too few runs can indicate the data needs to be stratified into sub-groups; you may be observing differences between a night shift and a day shift, for example. Stratifying may also help to identify disparities based on certain demographic factors. Graphing the data on two separate run charts will help you understand each sub-group better.
When we disaggregate the data, we may become more knowledgeable about what PDSAs may make a difference We could also make our aim statement more specific!
4 Rules of Nonrandom Signals of Change Rule #4 Astronomical Point An obviously and blatantly different value. Anyone studying the chart would agree that it is highly unusual. Rocco et al, 2011
Understanding Variation Since we are implementing changes in a real-world setting, there will be variation in the measure of the product or process due to causes unrelated to the change being tested The effect of the change must be distinguished from these unrelated variations
Understanding Variation Common Cause Variations Causes that are inherent in the system (process or product) over time, affecting everyone working in the system, and affecting all outcomes of the system A system that ONLY common cause variations affect the outcome is called a stable system Special Cause Variations The Healthcare Data Guide, p108
Understanding Variation Common Cause Variations Special Cause Variations Causes that are not part of the system (process or product) all the time or do not affect everyone, but arise because of specific circumstances. A system that contains both common and special cause variations that affect the outcomes is called an unstable system. The Healthcare Data Guide, p108
Common mistakes made with variations Common Cause Variations Treating common cause variation as if it was a special cause variation. Will cause one to adjust the system when the only way to improve the system is by fundamentally changing it. Special Cause Variations Accepting special cause variation as if it was a common cause variation. Will cause one to miss an opportunity to fix a problem. The Healthcare Data Guide, p108
How to Respond to Variation Type of Variation in Your Data Management Strategy Early Stage of Project: Investigate origins of special cause. If the special cause is negative, try to eliminate it. If the special cause is positive, we should try to learn from it and possibly replicate it. **Addressing special causes = creating a more stable, predictable system.** Later Stage of Project: The way improvement is manifested. We create a source of special cause that we control (our interventions) Special Cause Variation Reduce the amount of variation, and move the process average in the desired direction (change the underlying process). Testing changes in a stable system = more certainty that improvement is due to your intervention and not something else. Common Cause Variation, & Functioning at Unacceptable Level
How to Respond to Variation (Control Chart) Current State Action Required Unstable process Identify and eliminate bad special causes Special cause present Identify and build in good special causes Process average is high Source: Handbook for Improvement A Reference Guide for Tools and Concepts Healthcare Management Directories, Inc. 2002
How to Respond to Variation (Control Chart) Current State Action Required Stable process Take action to move the average of the process down create a special cause variation within the system to fundamentally change it Common cause variation has been reduced Process average is too high Source: Handbook for Improvement A Reference Guide for Tools and Concepts Healthcare Management Directories, Inc. 2002


")
")