Global Economic Prospects January 2022 - Insights and Forecasts

 
G
l
o
b
a
l
 
E
c
o
n
o
m
i
c
 
P
r
o
s
p
e
c
t
s
J
a
n
u
a
r
y
 
2
0
2
2
w
w
w
.
w
o
r
l
d
b
a
n
k
.
o
r
g
/
g
e
p
 
 
G
l
o
b
a
l
 
E
c
o
n
o
m
i
c
 
P
r
o
s
p
e
c
t
s


J
a
n
u
a
r
y
 
2
0
2
2
 
2
 
3
 
U
n
d
e
r
l
y
i
n
g
 
d
a
t
a
 
a
n
d
 
c
h
a
r
t
s
 
c
a
n
 
b
e
 
f
o
u
n
d
 
a
t
w
w
w
.
w
o
r
l
d
b
a
n
k
.
o
r
g
/
g
e
p
 
G
l
o
b
a
l
 
E
c
o
n
o
m
i
c
 
P
r
o
s
p
e
c
t
s


J
a
n
u
a
r
y
 
2
0
2
2
 
G
l
o
b
a
l
 
G
r
o
w
t
h
 
F
o
r
e
c
a
s
t
s
S
u
b
s
t
a
n
t
i
a
l
 
S
l
o
w
d
o
w
n
 
4
 
GDP growth
(Percent)
 
R
e
g
i
o
n
a
l
 
G
r
o
w
t
h
 
F
o
r
e
c
a
s
t
s
S
l
o
w
i
n
g
 
G
r
o
w
t
h
 
i
n
 
S
e
v
e
r
a
l
 
R
e
g
i
o
n
s
 
5
 
GDP growth, by region
(Percent)
 
U
n
e
v
e
n
 
G
l
o
b
a
l
 
R
e
c
o
v
e
r
y
W
e
a
k
 
O
u
t
p
u
t
 
a
n
d
 
I
n
v
e
s
t
m
e
n
t
;
 
L
a
s
t
i
n
g
 
S
c
a
r
r
i
n
g
 
6
 
Deviation of output with pre-pandemic trends by 2023
(Percent)
 
Deviation of investment from pre-pandemic trends
(Percent)
 
R
i
s
k
s
M
u
l
t
i
p
l
e
;
 
P
o
s
s
i
b
i
l
i
t
y
 
o
f
 
H
a
r
d
 
L
a
n
d
i
n
g
 
7
 
I
n
t
e
r
c
o
n
n
e
c
t
e
d
 
R
i
s
k
s
H
i
g
h
e
r
 
I
n
f
l
a
t
i
o
n
;
 
T
i
g
h
t
e
n
i
n
g
 
F
i
n
a
n
c
i
a
l
 
C
o
n
d
i
t
i
o
n
s
 
8
 
Inflation surprises
(Index, >0 = upside data surprise)
 
Financing conditions
(Index; January 1, 2021 = 100)
 
I
n
c
o
m
e
 
I
n
e
q
u
a
l
i
t
y
I
n
c
r
e
a
s
e
 
A
c
r
o
s
s
 
a
n
d
 
W
i
t
h
i
n
 
C
o
u
n
t
r
i
e
s
 
9
 
Change in between-country income inequality
(Point change; annualized)
 
Change in Gini index, 2020
(Points)
 
C
o
m
m
o
d
i
t
y
 
C
y
c
l
e
s
D
e
p
e
n
d
e
n
c
e
 
o
n
 
C
o
m
m
o
d
i
t
y
 
E
x
p
o
r
t
s
;
 
S
h
a
r
p
 
R
e
b
o
u
n
d
 
i
n
 
2
0
2
0
;
 
L
a
r
g
e
r
 
B
o
o
m
s
 
t
h
a
n
 
S
l
u
m
p
s
 
10
10
 
Commodity exports in EMDEs
(Percent of exports)
 
Energy prices and global recessions
(Percent change from previous year)
 
Amplitude of commodity cycles
(Percent)
 
L
e
s
s
o
n
s
 
f
r
o
m
 
P
a
s
t
 
D
e
b
t
 
R
e
s
t
r
u
c
t
u
r
i
n
g
s
E
l
e
v
a
t
e
d
 
D
e
b
t
 
i
n
 
L
I
C
s
;
 
P
a
s
t
 
R
e
s
t
r
u
c
t
u
r
i
n
g
s
 
O
f
f
e
r
e
d
 
S
u
b
s
t
a
n
t
i
a
l
 
D
e
b
t
 
R
e
l
i
e
f
 
11
11
 
Government debt in LICs
(Percent)
 
Debt relief granted
(
Percent of stock of debt
)
 
Number of debtor countries included
(Number)
 
P
o
l
i
c
y
 
P
r
i
o
r
i
t
i
e
s
M
e
a
s
u
r
e
s
 
t
o
 
E
n
s
u
r
e
 
G
r
e
e
n
,
 
R
e
s
i
l
i
e
n
t
,
 
a
n
d
 
I
n
c
l
u
s
i
v
e
 
G
r
o
w
t
h
 
12
12
 
M
o
n
e
t
a
r
y
 
a
n
d
 
F
i
s
c
a
l
 
P
o
l
i
c
i
e
s
P
o
l
i
c
y
 
T
i
g
h
t
e
n
i
n
g
 
U
n
d
e
r
w
a
y
;
 
S
p
a
c
e
 
L
i
m
i
t
e
d
 
13
13
 
Policy rates in EMDEs
(Percent)
 
Fiscal impulse in EMDEs
(Percentage points of potential GDP)
 
C
l
i
m
a
t
e
 
C
h
a
l
l
e
n
g
e
s
H
i
g
h
 
E
m
i
s
s
i
o
n
s
 
U
n
d
e
r
s
c
o
r
e
 
N
e
e
d
 
f
o
r
 
G
r
e
e
n
 
T
r
a
n
s
i
t
i
o
n
 
14
14
 
Change in greenhouse gas emissions
(Percent)
 
Share of renewables in global energy supply
(Percent)
 
G
l
o
b
a
l
 
E
c
o
n
o
m
i
c
 
P
r
o
s
p
e
c
t
s
J
a
n
u
a
r
y
 
2
0
2
2


www.worldbank.org/gep
 
 
15
15
 
S
e
l
e
c
t
 
P
u
b
l
i
c
a
t
i
o
n
s
 
b
y
 
E
F
I
 
P
r
o
s
p
e
c
t
s
 
G
r
o
u
p
 
16
16
 
G
l
o
b
a
l
 
E
c
o
n
o
m
i
c
 
P
r
o
s
p
e
c
t
s
 
 
J
a
n
u
a
r
y
 
2
0
2
2
(
J
a
n
u
a
r
y
 
a
n
d
 
J
u
n
e
)
C
o
m
m
o
d
i
t
y
 
M
a
r
k
e
t
s
 
O
u
t
l
o
o
k
 
 
O
c
t
o
b
e
r
 
2
0
2
1
(
A
p
r
i
l
 
a
n
d
 
O
c
t
o
b
e
r
)
G
l
o
b
a
l
 
M
o
n
t
h
l
y
 
 
O
n
e
-
S
t
o
p
 
S
o
u
r
c
e
:
 
G
l
o
b
a
l
 
D
a
t
a
b
a
s
e
 
o
f
 
I
n
f
l
a
t
i
o
n
 
 
J
u
l
y
 
2
0
2
1
I
n
f
l
a
t
i
o
n
 
D
u
r
i
n
g
 
t
h
e
 
P
a
n
d
e
m
i
c
 
W
h
a
t
 
H
a
p
p
e
n
e
d
?
 
W
h
a
t
 
i
s
 
N
e
x
t
?
 
 
J
u
l
y
 
2
0
2
1
 
T
h
e
 
A
f
t
e
r
m
a
t
h
 
o
f
 
D
e
b
t
 
S
u
r
g
e
s
 
 
S
e
p
t
e
m
b
e
r
 
2
0
2
1
A
 
M
o
u
n
t
a
i
n
 
o
f
 
D
e
b
t
:
 
N
a
v
i
g
a
t
i
n
g
 
t
h
e
 
L
e
g
a
c
y
 
o
f
 
t
h
e
 
P
a
n
d
e
m
i
c
 
 
O
c
t
o
b
e
r
 
2
0
2
1
W
h
a
t
 
H
a
s
 
B
e
e
n
 
t
h
e
 
I
m
p
a
c
t
 
o
f
 
C
O
V
I
D
-
1
9
 
o
n
 
D
e
b
t
?
 
T
u
r
n
i
n
g
 
a
 
W
a
v
e
 
i
n
t
o
 
a
 
T
s
u
n
a
m
i
 
 
N
o
v
e
m
b
e
r
 
2
0
2
1
Slide Note
Embed
Share

In the Global Economic Prospects January 2022 report by the World Bank, insights and forecasts about the global economic scenario, growth forecasts, risks like inflation and income inequality, interconnected risks, and lessons from past debt restructurings are discussed. The report highlights the substantial slowdown in global growth, uneven recovery, and the possibility of a hard landing. It also emphasizes the increase in income inequality across and within countries, the dependence on commodity exports, and the impact of elevated debt in Low-Income Countries (LICs). Detailed data and charts can be found on the World Bank's website.


Uploaded on Jul 19, 2024 | 7 Views


Download Presentation

Please find below an Image/Link to download the presentation.

The content on the website is provided AS IS for your information and personal use only. It may not be sold, licensed, or shared on other websites without obtaining consent from the author. Download presentation by click this link. If you encounter any issues during the download, it is possible that the publisher has removed the file from their server.

E N D

Presentation Transcript


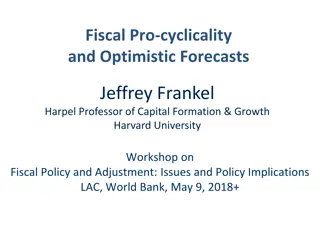
  1. Global Economic Prospects January 2022 www.worldbank.org/gep

  2. Global Economic Prospects January 2022 2

  3. Global Economic Prospects January 2022 Underlying data and charts can be found at www.worldbank.org/gep 3

  4. Global Growth Forecasts Substantial Slowdown GDP growth (Percent) 4

  5. Regional Growth Forecasts Slowing Growth in Several Regions GDP growth, by region (Percent) 5

  6. Uneven Global Recovery Weak Output and Investment; Lasting Scarring Deviation of output with pre-pandemic trends by 2023 (Percent) Deviation of investment from pre-pandemic trends (Percent) 6

  7. Risks Multiple; Possibility of Hard Landing 7

  8. Interconnected Risks Higher Inflation; Tightening Financial Conditions Inflation surprises (Index, >0 = upside data surprise) Financing conditions (Index; January 1, 2021 = 100) 8

  9. Income Inequality Increase Across and Within Countries Change in between-country income inequality (Point change; annualized) Change in Gini index, 2020 (Points) 9

  10. Commodity Cycles Dependence on Commodity Exports; Sharp Rebound in 2020; Larger Booms than Slumps Commodity exports in EMDEs (Percent of exports) Energy prices and global recessions (Percent change from previous year) Amplitude of commodity cycles (Percent) 10

  11. Lessons from Past Debt Restructurings Elevated Debt in LICs; Past Restructurings Offered Substantial Debt Relief Government debt in LICs (Percent) Number of debtor countries included (Number) Debt relief granted (Percent of stock of debt) 11

  12. Policy Priorities Measures to Ensure Green, Resilient, and Inclusive Growth 12

  13. Monetary and Fiscal Policies Policy Tightening Underway; Space Limited Policy rates in EMDEs (Percent) Fiscal impulse in EMDEs (Percentage points of potential GDP) 13

  14. Climate Challenges High Emissions Underscore Need for Green Transition Change in greenhouse gas emissions (Percent) Share of renewables in global energy supply (Percent) 14

  15. Global Economic Prospects January 2022 www.worldbank.org/gep 15

  16. Select Publications by EFI Prospects Group Global Economic Prospects January 2022 (January and June) Commodity Markets Outlook October 2021 (April and October) Global Monthly One-Stop Source: Global Database of Inflation July 2021 Inflation During the Pandemic What Happened? What is Next? July 2021 The Aftermath of Debt Surges September 2021 A Mountain of Debt: Navigating the Legacy of the Pandemic October 2021 What Has Been the Impact of COVID-19 on Debt? Turning a Wave into a Tsunami November 2021 16

Related


More Related Content

giItT1WQy@!-/#giItT1WQy@!-/#giItT1WQy@!-/#giItT1WQy@!-/#giItT1WQy@!-/#giItT1WQy@!-/#giItT1WQy@!-/#giItT1WQy@!-/#