Understanding Student Growth Measurements and Accountability
Discover the importance of measuring both achievement and growth in student learning, explore growth measures adopted in Virginia, and learn about student growth percentiles and progress tables for evaluating academic progress effectively.

Download Presentation

Please find below an Image/Link to download the presentation.
The content on the website is provided AS IS for your information and personal use only. It may not be sold, licensed, or shared on other websites without obtaining consent from the author. Download presentation by click this link. If you encounter any issues during the download, it is possible that the publisher has removed the file from their server.
E N D
Presentation Transcript
Student Growth Measurements and Accountability Virginia Association of School Superintendents Conference October 23, 2017
OUR GOALS FOR THIS SESSION Provide an overview of growth measures examined and adopted for Virginia. Consider a conceptual model for thinking about measuring growth. Review recent Innovation Committee recommendations and actions related to measuring growth. 2
Why Measure Growth? Considering both achievement and growth may provide a more complete picture of student learning. Achievement Did students pass the statewide tests? Growth Did students demonstrate progress based on where they started the school year? 3
Growth Measures Reviewed Student Growth Percentiles Progress Tables Predictive Models (2017 Growth Pilot SAS and Education Analytics) Vertical Scale
Student Growth Percentiles In 2011 VDOE examined Student Growth Percentiles and their use as a measure of academic growth for its reading and mathematics tests. A student growth percentile ranges from 1-99 and compares a student s current SOL score with the scores of students throughout the state with similar score histories. 5
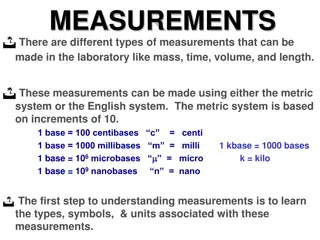
Progress Tables In the Progress Tables student growth is determined by comparing the student s test score in the current year to his/her prior test score. To facilitate the measurement of student growth, each of the performance levels used for the Standards of Learning tests in reading and mathematics, Below Basic, Basic, Proficient, and Advanced, is divided in half to create two sublevels. The resulting sublevels are: Low Below Basic, High Below Basic, Low Basic, High Basic, Low Proficient, High Proficient, Low Advanced, and High Advanced. 7
Performance Sub-Levels for Reading Virginia Reading SOL Sub-Level Cut Scores Below Basic Basic Proficient Advanced Grad e Low High Low High Low High Low High 0-280 281-309 310-361 362-399 400-438 439-499 500-511 512-600 3 0-277 278-302 303-359 360-399 400-438 439-499 500-512 513-600 4 0-270 271-294 295-360 361-399 400-438 439-499 500-512 513-600 5 0-291 292-316 317-364 365-399 400-440 441-499 500-511 512-600 6 0-291 292-314 315-365 366-399 400-440 441-499 500-511 512-600 7 0-293 294-316 317-366 367-399 400-438 439-499 500-507 508-600 8 8
Performance Sublevels for Mathematics Virginia Mathematics SOL Cut Scores Fail/Below Basic Fail/Basic Low High Low High Proficient Low Advanced Low Test Level High High 3 4 5 6 7 8 0-305 0-310 0-312 0-331 0-303 0-323 306-330 331-365 366-399 400-433 434-499 500-511 512-600 311-330 331-369 370-399 400-437 438-499 500-514 515-600 313-335 336-370 371-399 400-436 437-499 500-514 515-600 332-349 350-377 378-399 400-437 438-499 500-508 509-600 304-328 329-367 368-399 400-430 431-499 500-514 515-600 324-340 341-376 377-399 400-427 428-499 500-507 508-600 Test Level Fail Proficient Low Advanced Low Low High High High Algebra I 0-375 376-399 400-420 421-499 500-510 511-600 9
Determination of Student Growth Using Progress Tables Student progress is measured by whether a student who failed the reading and/or mathematics SOL test the previous year has moved at least one sublevel based on the current year s data. For example, a student whose score on the grade 3 reading test in 2015-2106 was high below basic has moved one sublevel if his score on the grade 4 reading test in 2016-2017 was low basic. 10
Use of Progress Tables in Combined Rate for Accountability Calculations for Reading and Mathematics Integrates achievement, growth, and progress for EL students towards gaining proficiency in reading. A student will be counted in the numerator of the reading or mathematics combined rate if: The student passes the assessment*; or The student does not pass the assessment but demonstrates growth using the progress tables; or For the reading assessment only, the student does not pass the assessment or demonstrate growth, but is an EL and demonstrates progress as measured by the ACCESS for ELLs 2.0 assessment. *Includes recovery Example of Reading Combined Rate Pass rate on state assessments: Student growth: English Learner progress: Reading combined rate 8 / 10 = 80% 12
Growth Pilot The 2016 General Assembly directed the Department of Education to conduct a pilot to investigate a student growth model that could be applied for school and division accountability. Contracts were awarded to:
Growth Pilot The proposed growth measures considered students prior achievement on SOL tests and the performance of similar students Statistical predictions were developed for how each student would score on the current year s test (predicted score) based on the student s performance on the previous year s test. A student s growth was then determined by whether the student fell below, met, or exceeded the predicted score and by how much.
An Example After the statewide assessments are administered, the data are used to calculate a statistical prediction for each student based on his or her characteristics and similar students across Virginia. 16
An Example Students actual scores and predicted scores are compared to determine whether each student met or exceeded the prediction and by how much. 17 Student 1: Student 2:
Proposed Growth Measures Using Predictive Models Growth results for a school could be determined by considering whether, on average, the school s students tended to exceed or not meet their predictions and by how much. 18
Current SOL Scale Scores on each SOL test are currently reported on a 0 - 600 scale that is specific to that test. 0 - 600 0 - 600 0 - 600 0 - 600 Grade 8 0 - 600 Grade 7 Grade 6 0 - 600 Grade 5 Grade 4 Grade 3 20
Vertical Scale A vertical scale would allow for the reporting of scores across SOL tests. For example, a vertical scale for reading could allow for the reporting of scores for the grade 3 reading test through the grade 8 reading test. 21
Sample Vertical Scale 8,000 Grade 8 Grade 7 Grade 6 2,000 Grade 5 Grade 4 0 Grade 3 22
Vertical Scaling Study Creating a vertical scale requires that we link the tests together. In spring 2016 a study was conducted to link the content of the reading tests for grades 3-8 and the mathematics tests for grade 3 Algebra I together so that a vertical scale could be created. Results are promising but must be re- evaluated based on the change in the mathematics SOL. 23
Potential Growth Measures with Vertical Scale and CAT Across-year growth: growth from test taken the previous year to test taken in the current year. Within-year growth: could allow for students to test in the fall and again in the spring to measure growth within the year. 24
Use of Computer Adaptive Testing to Support the Measurement of Growth Customized selection of items for students supports more precise measurement of student achievement and growth. Combined with the vertical scale, CAT supports off-grade level testing. 25
ESSA and Off-Grade Level Testing Under ESSA we must provide information regarding a student s proficiency in reading and mathematics in grades 3-8. However, unlike NCLB, ESSA also allows for off-grade level testing if a computer adaptive model is used. 26
Excerpt from ESSA (J) ADAPTIVE ASSESSMENTS. (i) IN GENERAL. Subject to clause (ii), a State retains the right to develop and administer computer adaptive assessments as the assessments described in this paragraph, provided the computer adaptive assessments meet the requirements of this paragraph, except that (I) subparagraph (B)(i) shall not be interpreted to require that all students taking the computer adaptive assessment be administered the same assessment items; and (II) such assessment (aa) shall measure, at a minimum, each student s academic proficiency based on the challenging State academic standards for the student s grade level and growth toward such standards; and (bb) may measure the student s level of academic proficiency and growth using items above or below the student s grade level, including for use as part of a State s accountability system under subsection (c). 27
Timeline for Implementation of Vertical Scales Mathematics 2018-2019 Additional linking studies will be needed in spring 2018 because of content changes in mathematics SOL. Reading Once curriculum framework is approved this fall, content changes in SOL will be evaluated so that a timeline can be determined. 28
Vertical Scale Characteristics Growth is based on comparing a student s performance to his/her own previous performance Expectations for growth can be defined so that the teacher and student know what is needed at the beginning of the year More sensitive measure than progress tables Understandable and transparent Supports off-grade level testing to measure growth
Use of Computer Adaptive Testing to Support the Measurement of Growth Without CAT, the number of testing opportunities for students is limited by number of test forms available With CAT, computer algorithm creates tests so number of test forms not applicable Customized selection of items for students supports more precise measurement of student achievement and growth Supports off-grade level testing May also be used for pre-test / post-test model to allow for the measurement of student growth within the same year
Different Measures, Different Purposes School Student Learning Accountability
Measuring Growth: Measuring Growth: Principles and Key Question Principles and Key Question Balanced Assessment System: The assessment system should include traditional achievement tests, growth measures and performance assessments across students school careers. What s Possible and What s Desirable: The system should include growth measures that are currently feasible, and should adapt as more direct measures become available. Can currently available SOL tests be used to measure growth in 3-8 reading and math? 32
IC Subcommittees First IC Subcommittee s First Recommendation on Growth Recommendation on Growth Recommend the use of linked SOL item banks to measure growth in grades 3-8 reading and mathematics, with assumptions. This recommendation passed the full Committee. 33
IC Subcommittees Second IC Subcommittee s Second Recommendation on Growth Recommendation on Growth Recommend ongoing research leading to implementation of more direct measures of student growth. This recommendation failed to pass the full Committee. 34