Financial Risk Protection for Universal Health Coverage in Bangladesh
This collection of images and data highlights the importance of financial risk protection in achieving universal health coverage in Bangladesh. It covers indicators and measurements related to health financing, trends in health expenditure, out-of-pocket payments, and distribution of healthcare costs across socioeconomic groups. It emphasizes the goal of ensuring that no individual faces financial hardship due to healthcare expenses.

Download Presentation

Please find below an Image/Link to download the presentation.
The content on the website is provided AS IS for your information and personal use only. It may not be sold, licensed, or shared on other websites without obtaining consent from the author. Download presentation by click this link. If you encounter any issues during the download, it is possible that the publisher has removed the file from their server.
E N D
Presentation Transcript
Financial Risk Protection for Universal Health Coverage - Indicators and measurements Jahangir A. M. Khan PhD Health Economics and Financing Research Group CEHS, icddr,b 1
Financial risk protection No one should die and suffer because they cannot afford health care, and no one should be made poorer because they get sick. 2
Health Financing in Bangladesh 2006 - 2007 Million Taka Tk. 69 = US $ 1 Private Insurane Tk. 314 0.2% Private Firms Tk. 1,325 0.8% Public Sector Tk. 41,318 26% Rest of the World Tk. 12,391 08% Household OOP Tk. 103,459 64% Source: Bangladesh National Health Accounts, 2007 NGOs Tk. 2,092 01% 4
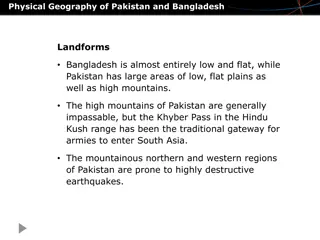
Trends in health expenditure in Bangladesh National Reports 2000 2003 10.1 115 WHO Estimates 2009 22.4 Issues 1997 9.2 2005 13.7 2007 16.2 2008 19.4 2010 24.8 2011 26.5 Total Health Expenditure in US$ per capita Total Health Expenditure as % of GDP 2.7% 2.8% 3.0% 3.2% 3.4% 3.5% 3.7% 3.7% 3.7% Mean annual growth rate in THE - 10% 8% 15% 16% - - - - Mean annual growth rate in GDP - 8% 10% 11% 14% - - - - Public expenditure on health as % of THE 36% 31% 28% 26% 26% 36% 37% 37% 37% Public expenditure on health as % of GDP 1% 1% 1% 1% 1% 1% 1% 1% 1% OOP as % of total health expenditure 57% 59% 61% 64% 64% 62% 61% 61% 61% NGO expenditure as % of THE 1% 2% 2% 2% 1% - - - - External assistance to NGOs as % of THE 5% 7% 9% 8% 8% - - - - Other private expenditure as % of THE 1% 1% 1% 1% 1% - - - - 5
OOP payments for health care as a percentage of total household consumption expenditure across SES SES Bangladesh 2.94 3.17 4.55 5.98 8.86 India 3.30 4.41 5.23 6.16 6.48 Nepal 2.44 2.71 2.90 2.86 3.64 Sri Lanka 1.64 1.82 2.00 2.21 2.86 Poorest 20% 2nd quintile 3rd quintile 4th quintile Richest 20% Source: Van Doorslaer et al. 2007 6
Distribution of out-of-pocket payment (%) across households in different socioeconomic groups, 2005 60.0 52.8 50.0 40.0 30.0 21.5 20.0 12.2 7.2 10.0 6.2 0.0 Poorest 2nd 3rd 4th Richest Source: Estimated 7
Coping mechanisms for healthcare expenditure, 2010 100% 85% 90% 83% 82% 80% 76% 80% 70% 60% 50% 40% 30% 22% 20% 20% 20% 18% 20% 5% 5% 10% 4% 3% 3% 3% 2% 2% 2% 2% 2% 2% 1% 1% 1% 1% 1% 1% 1% 0% 0% Poorest 20% 2nd quintile 3rd quintile 4th quintile Richest 20% Regular income Household saving Selling assets and other belonging Borrowing from friends, relative or lenders Assistance from friends & relatives Others Preliminary results
Catastrophic health care spending and coping mechanisms in Bangladesh - An analysis of Household Income and Expenditure Survey, 2010 9
The incidence of household catastrophic expenditure1) in different socioeconomic groups of urban and rural areas Socioeconomic Groups Poorest 2nd 3rd 4th Richest Total Rural Urban Total 16.6% 16.3% 15.9% 15.8% 16.6% 16.3% 10.6% 10.9% 10.2% 10.7% 6.8% 8.6% 16.5% 15.9% 15.0% 13.8% 9.2% 14.2% 1) OOPP share (at least 10%) of total household consumption expenditure 10
Pens Parade showing Impact of Healthcare Payments on Poverty 11
Remarks Many households face catastrophic health expenditure due to OOP payments OOP payments due to healthcare push people under poverty line Magnitude of OOPP shows only a part of problem related to affordability and can be considered as an underestimation as Those who did not receive any healthcare, though had illness, are not in the calculation of catastrophic payments. Thus, No pocket needs to be estimated based on Unmet need of care Risk-pooling mechanisms should be utilized more for reducing OOPP and its consequences 12
Indicators of financial risk protection Distributional dimensions* Urban: Slums and non-slums AND rural reachable and Categories Indicators at national level Health expenditure per capita financing Overall Health expenditure as % of GDP Private spending in health (per capita & as % of THE**) OOPP for health (per capita & as % of THE) OOPP for health in total household consumption expenditure Share of health spending in total government expenditure Public spending in health (per capita & as % of THE) Social HI contribution (per capita & as % of THE) CBHI contribution (per capita & as % of THE) Other health insurance (per capita & as % of THE) Share of households (%) borrow for healthcare Share of households (%) sell assets for healthcare Share of households (%) facing catastrophic health spending Share of population (%) fall into poverty due to OOPP Share of population (%) lack adequate healthcare due to financial hardship Private Across socioeconomic groups hard-to-reach areas Risk pooling Coping Economi Inaccess c impact ibility *Whenever applicable, **THE=Total health expenditure 13
Indicators of financial risk protection Financing mechanisms and its impacts Indicators should include level and distributional dimensions , like - Level = National - Distributional dimensions = Geographic areas, socioeconomic groups etc. Multiple indicators required 14
THANKS 15


 across")


 in")