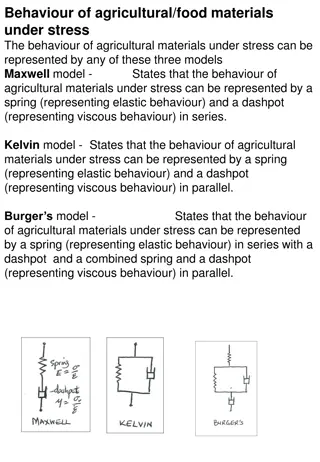
Understanding Stress-Strain Behavior in Materials

The stress-strain diagram illustrates how materials respond to mechanical forces, showcasing various properties such as elastic limit, yield point, ultimate strength, and rupture strength. By analyzing the curve, engineers can determine the material's behavior under different loads and stresses, aiding in design and structural integrity assessments. The linear segment represents Hooke's Law, while the plastic range signifies permanent deformation. Understanding these concepts is essential for material testing and structural design applications.

Download Presentation

Please find below an Image/Link to download the presentation.
The content on the website is provided AS IS for your information and personal use only. It may not be sold, licensed, or shared on other websites without obtaining consent from the author. Download presentation by click this link. If you encounter any issues during the download, it is possible that the publisher has removed the file from their server.
E N D
Presentation Transcript
Strain Strength of Materials
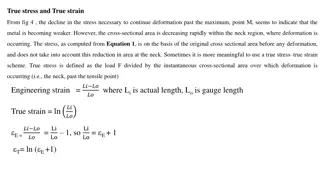
Stress-Strain Diagram Suppose that a metal specimen be placed in tension- compression testing machine. As the axial load is gradually increased in increments, the total elongation over the gage length is measured at each increment of the load and this is continued until failure of the specimen takes place. Knowing the original cross-sectional area and length of the specimen, the normal stress and the strain can be obtained. The graph of these quantities with the stress along the y-axis and the strain along the x-axis is called the stress-strain diagram. The stress-strain diagram differs in form for various materials. The diagram shown below is that for a medium carbon structural steel.
From the origin O to the point called proportional limit, the stress-strain curve is a straight line. This linear relation between elongation and the axial force causing was first noticed by Sir Robert Hooke in 1678 and is called Hooke's Law that within the proportional limit, the stress is directly proportional to strain or
ELASTIC LIMIT The elastic limit is the limit beyond which the material will no longer go back to its original shape when the load is removed, or it is the maximum stress that may e developed such that there is no permanent or residual deformation when the load is entirely removed. ELASTIC AND PLASTIC RANGES The region in stress-strain diagram from O to P is called the elastic range. The region from P to R is called the plastic range. YIELD POINT Yield point is the point at which the material will have an appreciable elongation or yielding without any increase in load. ULTIMATE STRENGTH The maximum ordinate in the stress-strain diagram is the ultimate strength or tensile strength. RAPTURE STRENGTH Rapture strength is the strength of the material at rupture. This is also known as the breaking strength.
AXIAL DEFORMATION In the linear portion of the stress-strain diagram, the tress is proportional to strain and is given by = E since = P / A and e = / L, then P / A = E / L. Solving for , To use this formula, the load must be axial, the bar must have a uniform cross-sectional area, and the stress must not exceed the proportional limit. If however, the cross-sectional area is not uniform, the axial deformation can be determined by considering a differential length and applying integration.