Understanding Fatigue Failure in Structural Materials

Fatigue failure is a common form of structural failure caused by repetitive loading, especially in metals but also affecting polymers and ceramics. This type of failure can occur at stress levels much lower than the material's static strength, often leading to sudden and catastrophic breaks without warning. Fatigue testing methods, such as rotating beam bending, help assess a material's endurance under cyclic stress conditions. The S-N curve is a vital tool in understanding a material's fatigue behavior, showing the relationship between stress amplitudes and the number of cycles to failure.

Download Presentation

Please find below an Image/Link to download the presentation.
The content on the website is provided AS IS for your information and personal use only. It may not be sold, licensed, or shared on other websites without obtaining consent from the author. Download presentation by click this link. If you encounter any issues during the download, it is possible that the publisher has removed the file from their server.
E N D
Presentation Transcript
Fatigue is a form of failure that occurs in structures subjected to repeatedly applied loads (e.g., bridges, aircraft, and machine components). Under these circumstances it is possible for failure to occur at a stress level considerably lower than the tensile or yield strength for a static load. Cyclic loading may be axial, bending or torsional Fatigue is important in as much as it is the single largest cause of failure in metals, estimated to comprise approximately 90% of all metallic failures; polymers and ceramics are also susceptible to this type of failure. Furthermore, fatigue is catastrophic and insidious, occurring very suddenly and without warning. Fatigue failure is brittle-like in nature even in normally ductile metals, in that there is very little, if any, gross plastic deformation associated with failure. The process occurs by the initiation and propagation of cracks, and ordinarily the fracture surface is perpendicular to the direction of an applied tensile stress. Cyclic stress-time modes are essentially of three main types: 1-Reversed stress cycle where the maximum and minimum stresses are equal, is commonly used in testing. 2- Repeated stress cycle where both stresses are tensile (greater than zero), but it is also possible to test with both stresses in compression 3- Random stress cycle in which the part is subjected to random loads during service
Mean stress, m= max+min/ 2 Figure (1) Modes of cyclic stress-time in fatigue Stress range, r= max- min Stress amplitude, a= max- min/ 2 Stress ratio R = min/ max
Fatigue testing methods Most common fatigue testing method is rotating beam bending : alternating tension and compression stress of equal magnitude on specimen as it simultaneously bend and rotate ( stress ratio R= -1) During rotation: lower surface is tension and upper surface is compression Figure(2) schematic of bending rotating fatigue instrument Figure (3) standard specimen of fatigue test
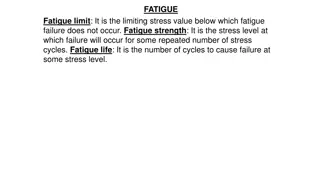
S-N curve A series of tests are commenced by subjecting a specimen to the stress cycling at a relatively large maximum stress amplitude ( a), usually on the order of two thirds of the static tensile strength; the number of cycles to failure is counted. This procedure is repeated on other specimens at progressively decreasing maximum stress amplitudes. Data are plotted as stress S versus the logarithm of the number N of cycles to failure for each of the specimens. The values of S are normally taken as stress amplitudes. Two distinct types of S N behavior are observed, which are represented schematically in Figure 4. As these plots indicate, the higher the magnitude of the stress, the smaller the number of cycles the material is capable of sustaining before failure. For some ferrous (iron base) and titanium alloys, the S N curve (Figure 4a) becomes horizontal at higher N values; or there is a limiting stress level, called the fatigue limit (also sometimes the endurance limit), below which fatigue failure will not occur
This fatigue limit represents the largest value of fluctuating stress that will not cause failure for essentially an infinite number of cycles. For many steels, fatigue limits range between 35% and 60% of the tensile strength. Most nonferrous alloys (e.g., aluminum, copper, magnesium) do not have a fatigue limit, in that the S N curve continues its downward trend at increasingly greater N values (Figure 4b) Thus, fatigue will ultimately occur regardless of the magnitude of the stress. For these materials, the fatigue response is specified as fatigue strength, which is defined as the stress level at which failure will occur for some specified number of cycles (e.g., cycles). The determination of fatigue strength is also demonstrated in Figure 4b. Another important parameter that characterizes a material s fatigue behavior is fatigue life NfIt is the number of cycles to cause failure at a specified stress level, as taken from the S N plot (Figure 4b).
Figure (4) S-N curve for a- ferrous alloys, -b- non-ferrous alloy
Crack initiation and propagation The process of fatigue failure is characterized by three distinct steps: (1) crack initiation, wherein a small crack forms at some point of high stress concentration (2) crack propagation, during which this crack advances incrementally with each stress cycle (3) final failure, which occurs very rapidly once the advancing crack has reached a critical size. Cracks associated with fatigue failure almost always initiate (or nucleate) on the surface of a component at some point of stress concentration. Crack nucleation sites include surface scratches, sharp fillets, keyways, threads, dents, and the like. The region of a fracture surface that formed during the crack propagation step may be characterized by two types of markings termed beach-marks and striations. Beach-marks (sometimes also called clamshell marks ) are of macroscopic dimensions (, and may be observed with the unaided eye and observed in components that experience interrupted crack propagation, e.g. machines that operates on a work-shift. On the other hand, fatigue striations are microscopic in size and subject to observation with the electron microscope (either TEM or SEM) and observed crack advancement in a single load cycle. there may be thousands of striations in a one beach-mark
Enhancement fatigue life Four measures that may be taken to increase the fatigue resistance of a metal alloy are: (1) Polish the surface to remove stress amplification sites. (2) Reduce the number of internal defects (pores, etc.) by means of altering processing and fabrication techniques. (3) Modify the design to eliminate notches (4) Harden the outer surface of the structure by case hardening (carburizing, nitriding) or shot peening. In shot peening, Small hard particles (shot) having diameters within the range of 0.1 to 1.0 mm are projected at high velocities onto the surface to be treated. The resulting deformation induces compressive stresses to a depth of between one- quarter and one-half of the shot diameter. The influence of shot peening on the fatigue behavior of steel is demonstrated schematically in Figure 6. Figure (6) Schematic S N fatigue curves for normal and shot-peened steel


 S-N curve for –a- ferrous alloys, -b-")