Causes and Consequences of Income and Wealth Inequality in the U.S.

Explore the causes, historical context, and policies related to income and wealth inequality in the U.S., with insights from Piketty's work and concerns about growing CEO pay disparities. Learn about Pikettymania and the looming specter of plutocracy.

Download Presentation

Please find below an Image/Link to download the presentation.
The content on the website is provided AS IS for your information and personal use only. It may not be sold, licensed, or shared on other websites without obtaining consent from the author. Download presentation by click this link. If you encounter any issues during the download, it is possible that the publisher has removed the file from their server.
E N D
Presentation Transcript
Income and Wealth Inequality in the U.S. Causes and Consequences Eshragh Motahar Fall 2016
Introduction What do we mean by inequality Income (pre-tax, post-tax), Wealth Is it inevitable Historical context What is new? Why should we care about it Policies
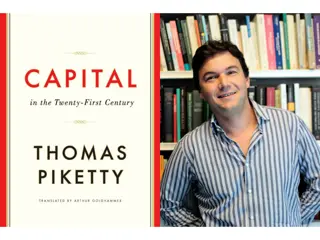
Book published in Spring 2014 Capital in the Twenty-First Century Piketty mania: how an economics lecture became the hottest gig in town http://www.theguardian.com/books/2014/jun/17/thomas-piketty-lse-capitalism-talk
Pikettymania A specter is haunting Europe and the U.S. the specter of plutocracy. In Britain, Deputy Prime Minister Nick Clegg has suggested the moment has arrived to consider a wealth tax. In France, which already has one, plans to ease its bite were recently canceled. Even in the more timid precincts of Washington, you cannot swing a V for Vendetta mask without hitting a think tank panel on inequality. Everyone, it seems, is worried we are shortly headed for a world in which a handful of rich people will own everything, and the rest are forced to rent their air and water from Mark Zuckerberg. http://www.businessweek.com/printer/articles/204120-pikettys-capital-an-economists-inequality-ideas-are-all-the-rage
CEO Pay These U.S. CEOs Make a Lot More Money Than Their Workers http://www.bloomberg.com/news/articles/2015-08-13/these-ceos-make-the-most-money-compared-with-their-workers Average CEO pay at the 350 largest U.S. companies by revenue surged 997 percent from 1978 to 2014, while the compensation of non-supervisory employees rose 10.9 percent, according to the Economic Policy Institute.
Income and Wealth Disparity The Gini Coefficient measures how equally distributed resources are, on a scale from 0 to 1. In the case of 0, everyone shares all resources equally, and in a society with a coefficient of 1, a single person would own everything. While income in the U.S. is distributed unequally, with a .574 gini, wealth is distributed far more unequally, with a gini of .834 and financial assets are distributed with a gini of .908, with the richest 10 percent own a whopping 83 percent. Source: The myth destroying America: Why social mobility is beyond ordinary people s control Americans overwhelmingly believe they control their financial destinies, but a huge body of research says otherwise Sean McElwee. Saturday, Mar 7, 2015. http://www.salon.com/2015/03/07/the_myth_destroying_america_why_social_mobility_is_beyond_ordinary_peoples_control/
Social Mobility A 2007 Treasury Department study of inequality allows us to examine mobility at the most elite level. On the horizontal axis (see below) is an individual s position on the income spectrum in 1996. On the vertical level is where they were in 2005. To examine the myth of mobility, I focused on the chances of making it into the top 10, 5 or 1 percent. We see that these chances are abysmal. Only .2 percent of those who began in the bottom quintile made it into the top 1 percent. In contrast, 82.7 percent of those who began in the top 1 percent remained in the top 10 percent a decade later.
Several studies have indicated that higher income inequality corresponds with lower income mobility. In other words, income brackets tend to be increasingly "sticky" as income inequality increases. This is described by a concept called the Great Gatsby curve.
In summary, as of now (in approximate numbers) The top 1% is taking home more than 20% of total income Owns at least 38% of total wealth The richest 400 people in the U.S. have more wealth than the bottom 150 million Americans put together CEOs of large corporations now earn 300 times wages of average workers (vs. 35-40 times in 50s- 60s)
The retirement savings accumulated by just 100 chief executives are equal to the entire retirement accounts of 41 percent of U.S. families -- or more than 116 million people, a new study finds. [Bloomberg, 2015] The combined wealth of the richest 1 percent will overtake that of the other 99 percent of people by 2016. [Oxfam, 2015]
Causes Pre-tax Globalization, Trade Policy Skill-bias technological change Declining union power Stagnant minimum wage Financialization Post-tax Tax laws Slashing welfare Neo-liberalism
Pikettys Contributions The truly rich top 1% [making it visible ] Inheritance we re on a path back to patrimonial capitalism, in which the commanding heights of the economy are controlled not by talented individuals but by family dynasties. It s a work that melds grand historical sweep when was the last time you heard an economist invoke Jane Austen and Balzac? with painstaking data analysis.
Pikettys Contributions (2) Income from capital vs. earned income (wages and salaries) Unequal ownership of assets, not unequal pay, is the prime driver of income disparities A good diagnosis is important if one is looking for remedies.
Why does it matter? Patrimonial capitalism Inequality of opportunity Oligarchy Lower growth (MPC differentials, etc.) More unstable economy: financial crises/deflation Reduced income mobility Higher levels of household debt Political/policy dimensions Disequilibrium dynamics
Is U.S. becoming an Oligarchy? Fewer than four hundred families are responsible for almost half the money raised in the 2016 presidential campaign, a concentration of political donors that is unprecedented in the modern era. The New York Times, August, 2015
Proposed Policies Policy matters (compare the U.S. with Sweden, Japan, France) The ideal solution: progressive wealth tax at the global scale, based upon automatic exchange of bank information Widely accessible education and healthcare (human capital) Trade deals Minimum wage
Conclusion Growth outlook Debt burden Several other challenges Prospects for policy changes
Scholarly Sources (1) IMF study finds inequality is damaging to economic growth International Monetary Fund paper dismisses the argument that redistributing incomes is self-defeating
Scholarly Sources (2) We use consumption and balance sheet data disaggregated between the top 5% and the bottom 95% of US households by income to show that the bottom 95% went deeply into debt to mitigate the impact of their stagnant incomes on their consumption. We use micro data to calibrate an intrinsic Keynesian growth model and show that over a range of plausible parameter values, the rise in US household income inequality increased enough between the early 1980s and 2000s to cause the entire magnitude of the Great Recession and can explain the slow and prolonged recovery. * Authors Cynamon: Visiting Scholar at the Federal Reserve Bank of St. Louis Center for Household Financial Stability; Fazzari: Departments of Economics and Sociology at Washington University in St. Louis.
. and even Income Inequality Hurts Economic Growth
Some Key Concepts Income (flow) Wealth (stock)
The T-shirt http://shop.comedycentral.com/The-Colbert-Report-r-g-Tee/M/B00KQ2T9KY.htm
r vs. g r rate of return on capital g rate of growth of income If r > g, then the ratio of capitalist s wealth to worker s wage increases at an annual rate of r g Thus r > g can be regarded as an amplification mechanism for existing inequalities, including labor income inequalities
Pikettys Numerical Estimates r = 4-5% g = 1.5 Thus, r g = 3%
CEO Pay Money to Burn: How CEO Pay is Accelerating Climate Change IPS: http://www.ips-dc.org/wp-content/uploads/2015/09/EE2015-Money-To-Burn-Upd.pdf


")
")
")
")


")


")
")