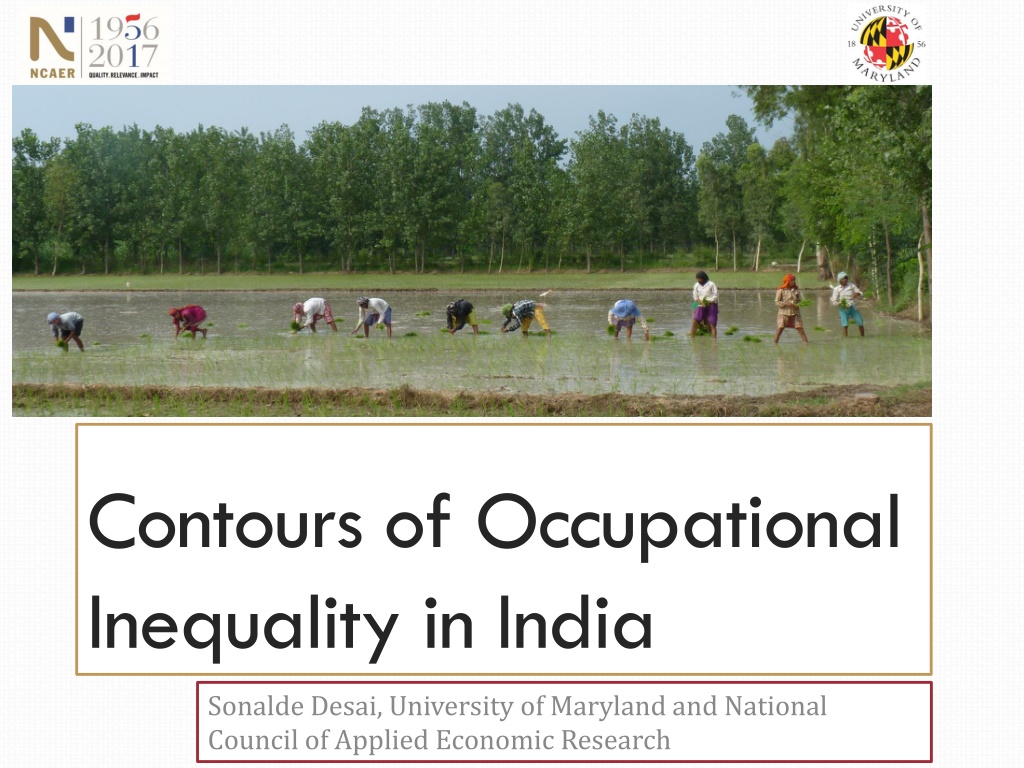
Contours of Occupational Inequality in India: Trends and Implications
Delve into the dynamic landscape of occupational inequality in India as depicted through changing economic power structures, shifting middle-class dynamics, and rising wealth disparities. Explore shifts in consumption expenditure by occupational groups, the impact of rising inequality on the country, and the evolving political economy landscape. Gain insights into the complexities of measuring inequality and its implications on different segments of society.

Uploaded on Sep 29, 2024 | 1 Views
Download Presentation

Please find below an Image/Link to download the presentation.
The content on the website is provided AS IS for your information and personal use only. It may not be sold, licensed, or shared on other websites without obtaining consent from the author. Download presentation by click this link. If you encounter any issues during the download, it is possible that the publisher has removed the file from their server.
E N D
Presentation Transcript
Contours of Occupational Inequality in India Sonalde Desai, University of Maryland and National Council of Applied Economic Research
The Idea of India. 2006 1984
Growing middle class Numbers remain fuzzy many estimates put it at 300 million but this may be too large a number (e.g. Credit Suisse puts it at about 30 million) Regardless of the exact estimates (and frankly, this is not a game worth playing!) growing wealth of India s upper and middle income groups has attracted tremendous attention around the globe, particularly among people who want to sell to this group But we know little about who forms a part of this middle class and whether it is really new Tremendous political economy implications whether the economic power is in the hands of farmers or educated salaried employees 1970s Charan Singh s Janata Party swept in to power via support from middle peasants in a protest wave against urban bias in public policy 2010s Kejriwal s Aam Aadmi Party gaining support of educated salaried workers on an anti-corruption wave
Changes in the composition of groups holding economic power Proportion of Household Consumption Expenditure by occupational group 1983-2012 40.0 35.0 30.0 25.0 20.0 15.0 10.0 5.0 0.0 1983 1987 1994 2000 2005 2010 2012 Professionals, Managers, Technicians Farmers Small Entrepreneurs
Changing occupational power structure in an era of rising inequality Inequality in India has been rising, regardless of the data we use Typical Indian discourse centered around government s CPS like surveys National Sample Surveys that only collect consumption expenditure Consumption data understate inequality Consumption smoothing via borrowing for the poor The rich do not consume all they earn Inequality based on income data is far larger
Overall inequality in India has been rising Consumption Gini from National Sample Survey Income Gini from India Human Development Survey Year 2005 2012 Gini Coeff 0.518 0.531 Year 1983 1987 1994 2000(*) 2005 2010 2012 Gini Coeff 0.323 0.324 0.316 0.304 0.344 0.345 0.351 * Different methodology
Little attention to occupational reward structure as a driver of inequality Between and Within Occupation Theil Index 0.350 0.300 0.250 0.200 0.150 0.100 0.050 0.000 1983 1987 1994 2000(*) 2005 2010 2012 Within Occupation Between Occupation Ratio
Goal of this presentation Describe the process through which some occupations gained and some lost Provide empirical contours for these trends Discuss the way in which Indian experience differs from that of the US and the West
Roots of occupational inequality have a long history Focus of this presentation is on empirical data between 1983 and 2012. 1983 and 1987 represent pre liberalization period, subsequent years show progressive liberatlization Part of the story will rely on historical data but most of the story is based on National Sample Surveys (NSS) between 1983 and 2012. These are CPS like surveys for over 100,000 households and contain data on employment, occupation and household consumption expenditure More recent and nuanced data come from India Human Development Survey (IHDS) of 2004-2005 and 2011-2012 and contain employment, income and expenditure data But we need to look a little farther back to understand the pre- liberalization period For just a few minutes, let us play post-colonial theorists favorite game of blaming everything on the empire
Mammoth conceptual challenges in a vast informal economy Biggest problem for the study of income inequality in India lies in the fact that a vast proportion of population is in informal economy family farms and small businesses where many different members of the household work So difficult to attribute income to individuals Hence, much of my story is based on households and not individuals NSS asked households to identify primary occupation and industry from which their income was drawn Once we get to IHDS, we can look at a more nuanced story of multiple occupations within a household and for the same individual
Political Economy of Occupational Reward Structure Pre Independence Era Before 1947 Post 1947-1985 reaction to the Colonial power structure Independence State Capitalism Began in 1985, intensified after 1991 reaction to dismantling of socialist regimes Increasing Liberalization
In service of the Empire.. Bureaucracy Pre Independence Power Structure Merchant Houses and nascent industrialists Landed Gentry - Zamindars
Machinery of the Empire Colonial administration in India consisted of two major services: Indian Civil Service Initially consisted of British public school educated sons of aristocracy and middle classes recruited through direct examination Later inclusion of Indians in early 20th Century Provincial Civil Services Recruitment in India of Anglo Indians, Indians etc. ICS officers dubbed the Heaven Born carried tremendous power and perks. Circa 1919, in the whole of the Federal Government of the United States there were only three officers whose salary was more than $8,000. In contrast, few ICS officers earned less than $7,000, for example Commissioner of Salt Revenue received $10,000 while Director of Post and Telegraph received $10,000. Provincial civil servants paid less than ICS but still VERY well paid compared to other Indians
Landlords or Zamindars who acted as revenue farmers for the British government Several systems of revenue collection in India but the one on Eastern and Central India relied on landlords as middlemen who collected rents from the subtenants and paid fixed revenue to the government, keeping the profits Revenue collection system in West and South were different but all led to substantial land concentration in the hands of wealthy landlords Tentant farmers and few rights and bore the weather related risks
Commercial and Industrial Middle Classes From 1757-1858 much of India was governed by the East India Company which conducted its business through middlemen based out of English Agency Houses. Indigenous traders began as clerks in the Agency Houses and slowly replaced them as middlemen following the bankruptcy of East India Company and takeover of Indian administration by the British Crown. They began operating around Presidency towns like Calcutta and Madras and then moved to smaller towns Away from the British stranglehold in Calcutta, they also began setting up coal, steel and textile manufacturing concerns in central and western India.
Marwari merchant and industrial houses A walk through one of the most remote parts of India, Shekhawati in Rajasthan, will show the wealth that poured into these region from her sons making commercial and industrial fortunes There are many havelis in a 50 km radius bearing illustrious names like Goenka, Bajaj, Piramal etc.
Expectations on the eve of Indian Independence in 1947 When India gained her Independence, it land reforms diminishing the powers of large landholders were fully expected But both indigenous industrial houses and bureaucrats expected to prosper once freed of the Colonial constraints. Bureaucrats expected the perks of top positions now to fully devolve to Indians and to replace the Raj functionaries. Industrial houses expected the Indian state to protect them from foreign competition and prosper. Gist of the Bombay Plan proposed on the eve of the Independence by large industrialists.
Central Planning and Intermediate Regime The Congress government quickly delivered on its promise to abolish Zamindari. Although land reform particularly land distribution to the landless laborers was never fully carried out, this broke the power of large land owners. But the other two groups did not anticipate Nehru s fascination for Central Planning and turn towards state capitalism Following Independence, Indian government adopted a central planning process and import substitution development in which imports were restricted and goods were divided into categories reserved for production by public sector units, production by large firms and production by small enterprises.
Indias Intermediate Regime The term Intermediate Regime was first articulated by Polish economist Michel Kalecki (who also served as an advisor to Govt. of India) Expanded by KN Raj (with admiration) and Prem Shankar Jha (with disdain) It has been argued that India s Intermediate Regime (1947-1985) benefitted middle farmers and small producers Later on Pronab Bardhan added bureaucracy to the group that also benefitted from this regime
The Intermediate Reigme... Winners Middle Farmers Small enterprise owners Lower level govt. servants Large farmers Large industrialists Upper level govt. servants Losers
FARMERS: DECLINE IN LARGE ABSENTEE LANDLORDS AND GROWTH OF MIDDLE FARMERS
Decline in area owned by large farmers, increase in area owned by med. & small farmers Percent of Total Agric. Area Covered by Farms of Different Sizes 35 Med. Large 30 Percent of Total Agr Area 25 Med 20 Small 15 10 Large Micro 5 0 1970 1976 1980- 1985 1990 1995 2000 2005 2010 Marginal Small Medium Medium Large Large
Increasing farm incomes due to green revolution and govt subsidies Farm productivity grew in 1970s and 1980s Government instituted minimum support prices for a variety of crops whereby farmers were free to sell in open market at whatever price they could get but government would be a buyer of last resort at preestablished prices. These prices were and continue to be reasonably high, increasing farmers incomes.
SMALL AND MEDIUM ENTREPRENEURS: PROTECTION FROM BEING SQUEEZED OUT BY LARGE COMPANIES
Control over large industries, preference for small manufacturers Import restrictions helped Indian industry Within it, growth of large companies restricted via production quota and reserving certain items for public sector companies as well as small scale industries Labor laws encouraged large companies to outsource Small manufacturers benefitted from this. Some items only small scale industries could produce Large companies outsourced certain manufacturing to small producers who could more easily ignore labor laws. Textile mills purchased from small powerloom operators who used family labor among others
Micro and Small Enterprises in India Over 90 percent of these enterprises are sole proprietorships Most have 2-4 employees Manufacturing 59%, 35% services, 6% repairing an maintenance Examples: Shoemaker Tailor Insurance agent Cyber caf operator Powerloom owner Plastic bag manufacturer Restaurant owner
Textile industry offers an interesting case study Only 10% of the production in large mills 60% in small powerlooms Many are family owned but some have a few employees
Indias Black or shadow economy It is impossible to estimate the size of India s parallel or shadow economy but estimated between 23 to 52 percent of the GDP, depending upon the method uses Black money available to: Self employed individuals who can hide this income on their income tax Government servants who collect bribes and obviously do not report them Since black money is hard to invest, it tends to boost consumption But decline in tax rates increases the disposable incomes of salaried workers who find it difficult to hide their incomes
High tax rates led to cheating on income tax, but only possible for certain occupations Top Marginal Tax Rates 100 90 80 70 60 Percent 50 40 30 20 10 0 Year
PUBLIC SERVANTS: LOSS OF PRIVILEGE FOR UPPER LEVEL BUREAUCRATS, LIVING WAGE TO LOWER LEVEL
Salary compression in public sector Public sector jobs about 2/3 of formal sector jobs Post Independence ideology Govt as a model employer and living wage to low level positions Resentment of colonial administration and efforts to suppress wages of top bureaucrats Ratio Highest to Lowest Govt. Salaries 40 35 30 25 20 15 10 5 0
LIBERALIZATION 1985 ONWARDS: DISMANTLING OF STATE CONTROLS
Liberalization began in 1985, accelarated in 1991 Secular changes Liberalization related changes Agricultural productivity slowdown Declining farm sizes Rising education with slow change in occupational structure Greater competition for formal sector jobs Easier entry for multinational firms Dismantling (although incomplete) of license raj including production quotas and reservation for small scale industries Decline in taxes Increasing salaries of public sector workers and some efforts at redressing salary compression Stagnation of public sector jobs
Liberalization sweepstakes Winners All govt. workers Professionals and managers Technicians Personal service workers Small entrepreneurs Farmers Laborers Losers
Churning occupational fortunes Decline- Farmers Fewer farmers Low productivity Rise-Formal sector Salary increase Tax decrease Self Employed- transformation More self employed Stagnant incomes Transformation of economic power structure
Farming is an increasingly unsustainable way of life Small farm sizes due to household division Stagnant farm productivity Indian farm productivity far lower than the US As a result Indian farmers are forced find any work they can to make the ends meet. This includes: Work on other people s farms as day laborers Non agricultural day labor in construction or in government sponsored public works programs Short term migration in search of work as laborers in nearby cities Far cry from the days of prosperous middle farmers at least in most areas of the country
Agriculture plays increasingly smaller role in household incomes, yet over 80% of the rural households engage in it Distribution of rural households by income source Income Sources for Rural Households by Income Quintile, 2011-12 100% 2004-05 2011-12 16 17 18 19 90% 21 Only farming Farming+Farm Labor 18.58 16.64 80% 70% 25.32 23.99 39 60% 57 56 58 56 Farm labor Farming+Non Farm 13.34 10.95 50% 40% 25.46 30.23 30% 42 20% Non farm only 15.52 15.28 27 27 24 24 10% Other 1.77 2.91 0% 1 2 3 4 5 Total 100 100 Household Income Quintile Only agiculture Combined Only non-agricultural
Monthly salaried work is a step up from daily labor Workers paid on monthly basis have year-round work, not available to daily laborers But this work could be in the formal sector and governed by labor legislation or in the informal sector Informal sector salaried workers Drivers, cooks, child care workers Workers in formal sector with informal jobs such as temporary or contract workers
Formal sector employment is a a tiny fraction of Indian workforce Proportion of Total Population Employed in the Organized Sector 0.045 0.04 0.035 0.03 Proportion 0.025 0.02 0.015 0.01 0.005 0
Rising education, slow expansion of jobs, results in higher competition Proportion of Secondary School and College Graduates Holding White Collar Jobs (Men ages 25-59) 80% 70% 60% 50% 40% 30% 20% 10% 0% 1983 1987 1994 2000 2005 2010 2012 Secondary College
All formal sector jobs not created equal Tremendous demand for public sector jobs for all education levels Government employs many drivers, clerks, technicians
Sharp increase in public sector salaries while employment share of public sector was declining Changes in Public Sector Payments and Employment Between 1972 and 2012 Per Capita Payments to Public Sector Workers Inflation Govt. Workers as % of Formal Workers 14000 80 70 12000 60 Percent Increase over 1971-72 10000 50 8000 Percent 40 6000 30 4000 20 2000 10 0 0 1972-73 1973-74 1974-75 1975-76 1976-77 1977-78 1978-79 1979-80 1980-81 1981-82 1982-83 1983-84 1984-85 1985-86 1986-87 1987-88 1988-89 1989-90 1990-91 1991-92 1992-93 1993-94 1994-95 1995-96 1996-97 1997-98 1998-99 1999-00 2000-01 2001-02 2002-03 2003-04 2004-05 2005-06 2006-07 2007-08 2008-09 2009-10 2010-11 2011-12
Amazing demand for government jobs In 2015, 2.3 million applicants for 656 jobs in state of Uttar Pradesh requiring class 5 education 255 applicants with Ph.D.; 200,000 applicants with BA/BS Number of Applicants for Union Public Service Examinations and Success Rate 1951-2016 12% 2520000 10% 2020000 8% 1520000 6% 1020000 4% 520000 2% 20000 0% 1951 1961 1971 1981 1991 2001 2011 2016
Salaried workers in public sector paid far more than in the private sector 2004-05 2011-12 Ratio Govt/Priv Ratio Govt/Priv Education Private Govt Private Govt Upto Class 5 Class 6-8 40889 96333 2.36 43200 120000 2.78 48818 111023 2.27 48000 133080 2.77 Class 9-10 62464 139258 2.23 60000 174000 2.90 Class 11-12 At least some college 63385 146591 2.31 72000 180000 2.50 91409 184354 2.02 120000 220400 1.84 Total 55364 140265 2.53 60000 180000 3.00
Pushed into self employment. What do people who can t get government jobs or formal sector jobs do? The lowest preference job is daily wage labor But many engage in small businesses or trades Crowding into self employment with poor returns Micro informal enterprises are 98% of all enterprises Extremely vulnerable, credit constraints
VERY slow transformation of occupational structure 1983 1987 1994 2000 2005 2010 2012 Upper Prof. & Manager 1.6 1.8 2.2 2.1 2.0 2.6 3.1 Lower Prof. & Teacher 3.3 3.3 3.5 3.6 3.6 3.1 3.4 Clerical 2.6 2.7 2.8 2.8 2.4 2.7 2.5 Working Proprietor 1.0 1.4 1.6 2.6 3.2 6.4 6.8 Merchant 4.6 5.1 5.4 5.3 5.6 3.9 4.1 Salesman 1.7 1.6 2.0 2.0 2.6 2.3 2.4 Personal Service 3.5 3.6 3.6 3.6 3.9 4.0 4.1 Agr w land +0.25 hect 33.0 29.0 27.6 24.6 24.9 21.4 21.4 Agric & Allied Worker 25.2 26.3 26.4 26.9 22.4 22.5 19.2 Prod. Worker/Artisan 14.1 14.4 14.9 14.5 17.5 15.6 17.2 Laborer 4.7 5.6 5.2 5.6 5.5 8.3 8.2 No Occupation/Retiree 4.8 5.1 4.8 6.4 6.4 7.3 7.6 Total 100 100 100 100 100 100 100
GROWING BETWEEN OCCUPATION INEQUALITY
Rapid increase in median incomes of some occupational groups (in constant Rupees, $1=Rs. 53 in 2011-12) 1983 1987 1994 2000 2005 2010 2012 Change Upper Prof. & Manager 8818 9771 9531 11201 11748 11780 12922 4104 Lower Prof. & Teacher 6000 6731 6758 7546 7651 7302 8113 2113 Clerical 7033 7328 7420 8613 8561 8539 9215 2182 Working Proprietor 7417 6896 7510 7931 7952 7730 7955 538 Merchant 4856 5243 5288 6109 6147 5826 6578 1722 Salesman 3963 4267 4626 5179 4750 5203 5830 1867 Personal Service 3993 4441 4381 5325 4732 5104 5827 1834 Agr w land +0.25 hectare 4217 4533 4356 5029 4812 5047 5527 1310 Agric & Allied Worker 2476 2754 2760 3310 3101 3372 3884 1408 Prod. Worker/Artisan 4238 4456 4555 5145 4670 4975 5686 1448 Laborer 3620 3661 3710 4307 3878 4031 4554 934 No Occupation/Retiree 1879 2387 2342 3091 2828 3664 3706 1827 5377 1683 Total 3694 3940 3965 4592 4403 4667
GROWING WITHIN OCCUPATION INEQUALITY