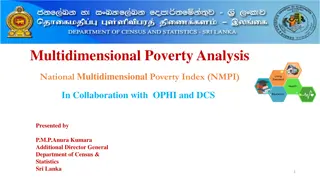
Global Perspectives on Poverty and Inequality

Explore dimensions of poverty and inequality worldwide through images and data on living conditions, GDP per capita, household income, and life expectancy in various countries. Learn about income distribution, family living conditions, and the Dollar Street project revealing disparities in lifestyles based on income levels.

Download Presentation

Please find below an Image/Link to download the presentation.
The content on the website is provided AS IS for your information and personal use only. It may not be sold, licensed, or shared on other websites without obtaining consent from the author. Download presentation by click this link. If you encounter any issues during the download, it is possible that the publisher has removed the file from their server.
E N D
Presentation Transcript
Georgetown University ECON 156: Poverty and Inequality Lecture notes to accompany Ravallion sThe Economics of Poverty. Part 3, Chapter 7: Dimensions Poverty and Inequality in the World Martin Ravallion
There are large differences in living conditions across the world today 2
For GDP per capita by year see Our World in Data. These are averages. What about household income?
Penns parade of world incomes Household income per person in $ s per day in 2008 Mean income in $/day by ventile, 2008 100 80 60 40 20 0 2 4 6 8 10 12 14 16 18 20 4 Source: Lakner and Milanovic, 2013, Global Income Distribution, Policy Research Working Paper 6719, World Bank.
Penns parade of world incomes Household income per person in $ s per day in 2008 200 Mean income by ventile ($/day) Mean for top 1% 160 120 80 40 0 2 4 6 8 10 12 14 16 18 20 5
Family living conditions across the world USA Life expectancy at birth: 79 years Source: Selected from 32 photos by Peter Menzel. Life expectancy for 2015. 6
Brazil China Life expectancy: 76 years Life expectancy: 75 years 7
Mali India Life expectancy: 58 years Life expectancy: 68 years 8
Dollar Street 7 8 9 10 1 2 3 4 5 6 Imagine a street of 10 houses with the poorest on the far left and richest on the far right. Where would you put your family on this street? The Dollarstreet project by Gapminder shows you how people live across the world at different income levels. Similar consumption at the same income. Also see this TED talk by co-founder of Gapminder, Anna Rosling Roonlund. 9
Learning about poverty from vignettes Some surveys have described various families and asked respondents to rank their economic welfare on an ordinal scale. Imagine a 6-step ladder where on the bottom, the first step, stand the poorest people, and the highest step, the sixth, stand the rich. On which step are you today? The same respondent is then asked to rank her/his own welfare on the same scale. Let s look at results for three countries. 10
Guatemala % of survey respondents who rated their own welfare at or below this family 32% Family Castillo lives in an adobe house with one room and no latrine. The house does not have electricity or running water. The family eats beans and tortillas, but is never able to afford meat, eggs. Family Gomez lives in an adobe house with two rooms and a latrine. The house has electricity but no running water. The family owns a bicycle and small battery-powered radio. They eat mainly beans, eggs, tortilla, rice and corn. 79% 11
Tajikistan % of survey respondents who rated their own welfare at or below this family 14% Family A can only afford to eat meat on very special occasions. During the winter months, they are able to partially heat only one room of their home. They cannot afford for children to complete their secondary education because the children must work to help support the family. When the children are able to attend school, they must go in old clothing and worn shoes. There is not enough warm clothing for the family during cold months. The family does not own any farmland, only their household vegetable plot. Family B can afford to eat meat only once or twice a week. During winter months, they can heat several rooms, but not the entire house. They cannot afford for all their children to complete secondary education. Their clothing is sufficiently warm, but they own only simple garments. In addition to their household vegetable plot, they own a small plot of poor quality farmland that is distant from their home. 60% 12
Tanzania % of survey respondents who rated their own welfare at or below this family 25% Joseph's/Josephine's family has 6 people 3 adults and 3 children living in a mud house with the river as the main source of water. One of the children is in primary school. None of the adults are literate. The family has no land and supports itself by engaging in casual agricultural labor for a large landowner. The have one small meal a day and very rarely eat matooke, meat or fish. The family has no furniture and sleeps on the floor. Edward s/Esther s family has 6 people 3 adults and 3 children living in a mud house with the river as the main source of water. One of the children is in primary school. None of the adults are literate. The family has a one acre banana plantation. The adult male does some casual labor in construction in town. The family eats two small meals a day, and is able to occasionally eat meat or dagaa. The family has three old mattresses, a bench for guests and a few chickens. 61% 13
Access to basic services 100% Poor Non-Poor Percentage of population with access 87% 80% 60% 61% 56% 49% 40% 26% 20% 20% 0% Water Electricity Sanitation Poor : consumption or income less than $1.25 a day Non-poor : the rest. 14
Outline Part 3, Chapter 7 1. Poverty and inequality in America 2. Global inequality 3. Global poverty 3.1 Absolute poverty globally 3.2 Taking social effects on welfare seriously 3.3 Measures of absolute poverty 3.4 Measures of relative poverty 3.5 Overall measures of global poverty 4. Urban and rural dimensions of poverty 5. Non-income dimensions of poverty 5.1 Child development and poverty 5.2 Demographics of poverty 5.3 Schooling and poverty 5.4 Gender dimensions of poverty 5.5 Nutrition and poverty 5.6 Violence and poverty 15
1. America 16
Growth incidence curves for US Pre- and post-tax 1967-2015 18 Source: Wimer et al. 2020 (*)
Two periods in America: 1946-1980 and 1980-now Growth incidence curves: 19 Source: Saez and Zucman
Gini index in US Market incomes Disposable incomes Redistribution Source: Branko Milanovic 20
Rising inequality of incomes and wealth in America since around 1980 Gini= 0.58 The rise in income inequality has been more marked than for wealth. But note how much higher the Gini index is for wealth than income. Imagine 10 households with wealths: (1,2,3,4,5,6,7,8,9,X). What is X to get Gini=0.86? X=750. Gini= 0. 86 Source: Kuhn et al. 2020 21
Income share held by the richest one percent of American households Share of household income in the U.S. held by top 1% 25 20 15 10 5 Share excluding capital gains Share including capital gains 0 1910 1920 1930 1940 1950 1960 1970 1980 1990 2000 2010 2020 Source: Alvaredo et al. (2014); author s estimates of a nearest neighbor smoothed scatter plot. 22
Rising share of top 0.1% in US since late 1970s; returning to level of early C20th. (Graphic from Economist magazine.) 23
Inequality of market incomes is rising faster than disposable income, esp. US Redist- ribution Source: OECD; for OECD as a whole see this paper. Note: Market income: income from all sources; Gross income: market income less all transfers; Disposable income: Gross income net of taxes. 24
And the floor in US is sinking! Stabilized in 2000s, mainly due to social policy (esp. SNAP) 7 6 Floor in $ per person per day 5 4 3 2 1 0 1986 1988 1990 1992 1994 1996 1998 2000 2002 2004 2006 2008 2010 2012 2014 Note: 2010 prices; family of 4 (2 adults, 2 children) 25 Source: Joliffe et al. 2020.
Differing fortunes in US Divergence is absolute and relative 500 quantile 99% Income in $ per day, 2010 prices 400 300 quantile 95% 200 quantile 90% 100 mean median floor 0 1986 1988 1990 1992 1994 1996 1998 2000 2002 2004 2006 2008 2010 2012 2014 26 Source: Jolliffe et al. (2020)
Declining absolute income mobility in US Source: The Equality of Opportunity Project. 27
Local inequality: Washington DC DC has the highest income inequality of any major metropolitan area of the US, with a Gini index of about 0.60. This reflects the special nature of DC and its history of in-migration by both the rich and poor. Also note that the large Washington area (incl. Arlington and Alexandria (DC-VA-MD-WV) has average inequality for the US. However, some of the costs of high inequality (as we discuss later) are likely to be localized. 28
20% 40% 60% Gini indices within countries DC! (Gini=60%) Source: World Bank, 2006, World Development Report, Oxford University Press
Factors underlying the rise in US inequality 30
Side-by-side with rising inter-personal inequality in US we have seen: Falling labor share in national income Measured by ratio of worker compensation to national income Falling in US since 1980; around 66% in 1980; <60% now. Falling participation in labor unions Down from 20% of workers in 1980 to about 10% now. Rising industrial concentration Larger and fewer firms; superstars ; less competition. Higher markups in pricing; higher profits => lower labor share. Labor share has fallen faster in US industries that have become more concentrated. Rising returns to higher education => Higher costs of college education but also higher earnings gains. 31
Real wages by education over time in US Source: David Autor 32
Recent signs of a brake to the rise in inequality in America (pre-COVID) Federal Reserve s Survey of Consumer Finances indicate that median household pre-tax income grew by 5% over 2016-19, However, the mean fell by 3%, mainly due to decline in incomes of the top 1%. Are we seeing the end of rising inequality in the US? The pandemic may well have increased inequality, as the poor and middle-income groups are probably less able to protect their living standards. We await to see what new data tell us! 34
Identities matter to inequality and injustice Just as nationality may matter to assessments of inequality, other aspects of identity have a salience that is hidden by standard measures. Ethnicity, race, religion and gender have been important examples. Even small between-group disparities have a large social and political significance. Standard decomposition methods do not attach any extra weight on group identity. Yes, there are inequalities between groups, But they are given the same weight as inequalities within groups. 36
Stubborn and worrying inequalities by race in the U.S. Soon after the 50th anniversary of Martin Luther King Jr. s I Have a Dream speech, how are we doing in reducing racial economic disparities? The black unemployment rate has remained about twice the white rate for 50 years The gap in household income hasn t narrowed in the last 50 years Blacks are still far less likely to be health-insured than whites. 37
Racial wealth gap in US Source: Brad Plumer, Washington Post, August 28, 2013. In 2016, non-Hispanic White families had a median net worth that is 8-10 times higher than the other two main race groups. 38
Other indicators of the racial wealth gap Home ownership rates (2011): White families: 73% Black families: 45% Hispanic families: 47% Median wealth return to graduating college (2011): White families: $60,000 Black families: $4,846 Hispanic families: $4,191 39
Absolute poverty line in the U.S. Unusually amongst rich countries the U.S. uses an absolute line adjusted only for inflation over time. US official line developed in 1965 by Mollie Orshansky, an economist working for Social Security Administration. A 1955 survey to determine the nutritionally adequate but socially acceptable food bundle. Poverty defined as making less than three times the cost of this diet; factor of three came from a 1955 study indicating that food spending accounted for one-third of a typical family s budget. Currently the threshold is set at $24,069 for a family of four ($16 per person per day). Adjusted over time for inflation nationally, but no adjustment for geographic cost-of-living differences. 41
Debates on US poverty: Is the official line too low or too high? The U.S. line is the average line for countries with only about one third of the mean consumption level of the US. Also low relative to the social subjective poverty line. But the income concept excludes taxes/transfers! 50 National poverty line ($PPP per day per person) Luxembourg 40 30 20 USA 10 0 0.0 0.5 1.0 1.5 2.0 2.5 3.0 3.5 4.0 4.5 5.0 Log private consumption per capita ($PPP per day) Note: Official line in 2005 is $13 is $13 per day (family of 4 with 2 kids). In 2013 it is about $16 per day 42
Official measures show little long-term progress against poverty Little progress against poverty: 1980-2015: the official poverty rate rose by 0.5% points. Growth rates in household incomes tended to be higher for poorer groups, undoing some of the rise in inequality that we have been seeing in the US for many years. Among those who are below the official line, a rising share are living on less than half that line. 43
Recent progress threatened by the 2020 pandemic Good news in 2015-19: the US poverty rate fell and median incomes rose. See the official report. Official poverty rate in 2019 is 10.5%. 3-year average for 2017-19 is 11.5%. Early evidence suggests that the US poverty rate has risen during the 2020 pandemic. This has been counteracted to some extent by enhanced spending on social protection. 44
Three measures of poverty in the US Using the official poverty line. Three measures in the Foster-Greer-Thorbecke class. .16 .14 .12 Poverty measure Poverty measure Headcount index Poverty gap index Squared poverty gap index .10 .08 .06 .04 .02 1988 1992 1996 2000 2004 2008 2012 2016 Source: Calculations from successive rounds of the Annual Social and Economic (ASEC) Supplement to the Current Population Survey (CPS). 45
Alternative measures of poverty for US Official measures use pre-tax money income. This leaves out the effects of some pro-poor policies. New Census Bureau supplementary poverty line is more generous but uses a better income concept. Similar overall poverty rate, but no series over time. Regional COL differences (e.g., Texas vs California). Consumption poverty measures have become available and show much more progress against poverty. Consumption poverty rate has fallen over time, despite the lack of progress indicated by the official poverty measures. 1980-2015: consumption poverty rate down by 9.4% points. See Meyer and Sullivan, Figure 1 here) 46
Poverty in the US by race/ethnicity Note: Non-Hispanic whites have a lower poverty rate (% of this group) but around half of the poor are white. 47
Washington DC stands out again! Headcount index 2013 25.0 20.0 15.0 10.0 5.0 0.0 Hawaii New Jersey New York Alabama Utah Virginia Maine Montana Vermont Iowa Alaska Ohio California Nevada Colorado Connecticut Wyoming Oregon South Dakota Washington Missouri Delaware South Carolina West Virginia North Carolina North Dakota Indiana Illinois Rhode Island Arkansas Tennessee Minnesota Michigan Kansas Nebraska Idaho Florida Georgia Texas Massachusetts Kentucky Maryland Louisiana Arizona Wisconsin Mississippi Pennsylvania Oklahoma District of Columbia New Mexico New Hampshire US as a whole 14.5% 6.3% Washington DC 21.3% 11.5% Poverty rate (100% official line) Poverty rate (50% official line) Update for 2017 is here. 48
Poverty rates across counties of the US 3,000 counties. Overall, the poverty rate is 15%. But wide variation. Ranging from 2.6% (Douglas County, CO) to 54% (Oglala Lakota County, SD). Strong correlation with average household income. Elasticity = -1.5. 4.5 Poverty rate (official line; log scale) Poverty rate (official line; log scale) 4.0 3.5 3.0 2.5 2.0 1.5 1.0 0.5 10.0 10.2 10.4 10.6 10.8 11.0 11.2 11.4 11.6 11.8 12.0 Median household income (log scale) Median household income (log scale) 49
The changing geography of poverty in the US Historically, poverty measures have been higher in both large inner- city areas and more remote or rural communities. This is changing, with poverty shifting to suburbs. Suburbs account for half of the increase in number of poor 2000-15. 50