Impact of Shale Gas Extraction on Climate
Shale gas extraction presents both benefits and challenges, including impacts on air quality and global climate, as well as the need for infrastructure expansion. The process involves unconventional methods with varying outcomes, affecting local communities and the environment. Despite being a cheap energy source with domestic reserves, its impacts on climate and air quality necessitate careful consideration and regulation.

Download Presentation

Please find below an Image/Link to download the presentation.
The content on the website is provided AS IS for your information and personal use only. It may not be sold, licensed, or shared on other websites without obtaining consent from the author. Download presentation by click this link. If you encounter any issues during the download, it is possible that the publisher has removed the file from their server.
E N D
Presentation Transcript
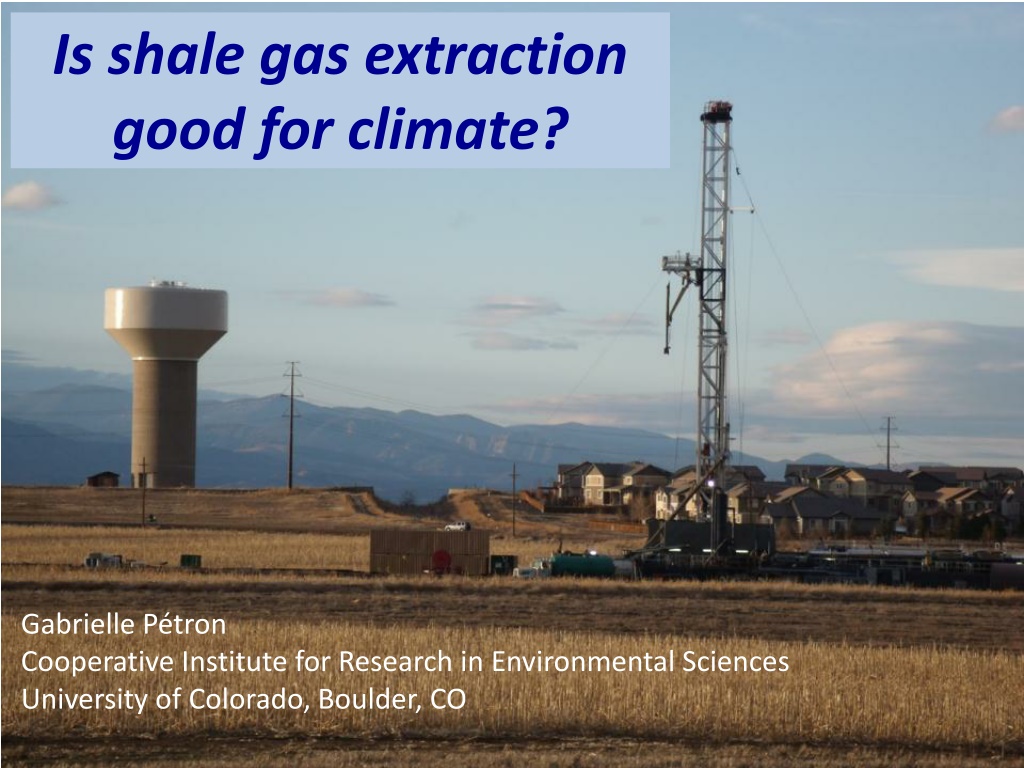
Is shale gas extraction good for climate? Gabrielle P tron Cooperative Institute for Research in Environmental Sciences University of Colorado, Boulder, CO
Any opinions, findings, and conclusions or recommendations expressed in this material are those of the author and do not necessarily reflect the views of the US National Oceanic and Atmospheric Administration, the University of Colorado at Boulder, or the US National Science Foundation.
NOAA Global Monitoring Division Primary Mission: Long-term High Quality Measurements of the Atmosphere Properties Climate Forcing Stratospheric Ozone Air Quality CarbonTracker observational network CT2009 90 N 60 N 30 N Eq 30 S 60 S 90 S 180 W 120 W 60 W 0 E 60 E 120 E 180 E Platform surface flask surface continuous tower continuous aircraft flask ship flask http://esrl.noaa.gov/ gmd/dv/iadv/ Calibrated Long-term Transparent Publicly available
Unconventional NG in the US Benefits & Challenges Sharp decline rate of well production Heterogeneity of results (sweet spots) Water availability, recycling and disposal Regional air quality impacts (surface ozone) Global climate impacts Need to expand infrastructure to reduce flaring in oil fields The public, local governments in some areas are divided Cheap energy source Large domestic reserves Cleaner burning than coal Existing infrastructure, technical know-how (jobs) Strong federal and state governments support Mineral rights belong to private entities (not always true in the West) 12? Pounds? of? CO2? per? MWh? 2500? coal? natural? gas? EIA 10? 2000? 8? $/MCF? 1500? 6? 1000? 4? 500? 2? 0? EIA exis ng? plants?average? new? 0? plants? 1974?1979?1984?1989?1994?1999?2004?2009?2014?
US Increasing Reliance on Unconventional Gas 2011 in the US: 3414 new shale gas wells & 6759 new shale oil wells Expenditures: 65.5 billion $ Source: API, 2013 US Dry Gas Production Tcf * 2011 US production ~ 20% of world production * 1500? Number? of? Rigs? ? * Gas? Oil? 1000? 500? * Shale gas, tight gas and coalbed methane are also called unconventional gas. 0? 1990? 1995? 2000? 2005? 2010? Source: US Energy Information Administration, AEO2012
How to assess the climate benefits of natural gas? Air emissions estimation from all segments of natural gas systems: Production Processing Transmission and Storage Distribution Life Cycle Assessments: estimate GHG emissions over lifetime of a well compare GHG emissions for different fuels per unit of product (MWh for ex.) 1. Emissions from Well (re) Stimulation High volume high pressure hydraulic fracturing or refracturing Flowback Mitigation (voluntary/mandatory) 2. Estimated Ultimate Recovery (EUR) (incl. lifetime of producing well) 3. Production rate over lifetime 4. Co-products Emissions (oil and gas) Ex. Flaring/venting Distinguish shale/tight gas, associated gas from shale/tight oil wells versus conventional gas.
Oil & Gas Emissions Inventories Up-to-date emission factors Mean Statistical distribution for each source type Accurate Inventory of Activity Data Equipment Operations Production Potential Emissions Actual Emissions Documented emissions reductions/controls (Voluntary & Mandatory) Requirements Harmonized source categories for all pollutants For each source category: Activity Data (year/month specific) Activity/equipment counts Production data Emissions Statistics Distribution Mean Variability Composition Profile Controls or not (effectiveness) Low threshold for permitting ensures inventory developers have information on small-medium size facilities Best knowledge transparent bottom- up inventory
Oil & Gas Emissions Inventories Up-to-date emission factors Mean Statistical distribution for each source type Accurate Inventory of Activity Data Equipment Operations Production Potential Emissions Actual Emissions Documented emissions reductions/controls (Voluntary & Mandatory) Sources State agencies: Oil and Gas Commission Air Division O&G Operators: Reported data (EPA GHGRP) Surveys (WRAP) Related industries (IHS, DI Desktop, ) Limited direct measurement studies Emission factors (Ex: EPA/GRI, 1996) Best knowledge transparent bottom- up inventory
US Natural gas systems: Large infrastructure How much gas is leaking from US natural gas infrastructure? 1,000,000 oil and gas wells 493 processing plants, over 20,000 miles of gathering pipelines, ~ 300,000 miles transmissions pipelines, > 1,400 compressor stations ~ 400 underground storage facilities ~ 2,000,000 miles of distribution pipelines US Statistics: EIA, DOT, OGJ
Whats in natural gas? Surface ozone precursors Air Toxics n-Pentane Benzene Toluene CO2 N2 Cycloalkanes i-Pentane C6+ Heavies n-Butane i-Butane Propane NGLs Ethane Composition of gas varies from one basin/formation/well to another. Methane (CH4) Methane Produced raw gas is composed of 70-90% methane Distribution gas is >90% methane
US EPA estimates of CH4 emissions from NG US EPA GHG inventory Methane national emissions (Tg/yr) Field production Transmission and Storage Processing Distribution 12 12 12 12 2011/2012 EPA 2013 EPA 2010 EPA US GHG inventory 10 10 10 10 Methane emissions 8 8 8 Methane emissions Methane emissions 6 6 6 2.5% leak rate 1.5% leak rate 8 Methane emissions 4 4 4 2 2 2 6 0 0 0 1990 1992 1994 1996 1998 2000 2002 2004 2006 2008 2010 1990 1992 1994 1996 1998 2000 Year 2002 2004 2006 2008 1990 4 1992 1994 1996 1998 2000 Year 2002 2004 2006 2008 Year Inventory-based estimates of CH4 emissions from US NG systems Have changed dramatically over the past 4 years Need to be assessed by independent methods 2 0 1990 1992 1994 1996 1998 2000 Year 2002 2004 2006 2008
How do we measure the air composition to track Emissions and Air Impacts? Tower, aircraft, balloon and van in-situ and canister sampling sampling system CCGG MAGICC CO2 CH4 N2O SF6 CO H2 HATS GC/MS 43 species
Atmospheric Impacts from Oil and Natural Gas Systems Surface enhancements of alkanes and alkylnitrates in Texas & Oklahoma, Katzenstein et al., 2003 Field measurements in the US suggest that methane and Volatile Organic Compounds (VOCs) emissions are likely under- estimated by inventories: Oil and gas production in TX, OK, KS: Katzenstein et al. PNAS, 2003 in CO and UT: P tron et al., JGR, 2012, Karion et al., GRL, 2013 Natural gas distribution in cities In Boston: Phillips et al., EP, 2012 In Washington DC: Jackson et al., on-going CH4 Methane leaks in Boston, Phillips et al., 2012
Can we detect CH4 emissions in the atmosphere? CH4 cloud from surface emissions Atmospheric measurements wind Ambient levels of CH4 measured by tower, instrumented van or aircraft downwind of the area source reflect emissions from oil and gas production operations
Mass Balance Approach for Emissions Estimation Wind Wind mixing height (PBL) Downwind CH4 Background CH4 emissions Molar CH4 enhancement in PBL CH4 flux z + b PBL gnd = cos n V X n dz dx CH CH air 4 4 b z Perpendicular wind speed References: White et al., 1976; Ryerson et al., 2001; Mays et al., 2009
Uinta Basins Sea of CH4 Flight Track color-coded by CH4 level 2/7/2012 Low wind Measurements on February 3, 2012 (stronger winds) suggest a leakage rate of 6-12%, compared to the EPA national average of 1.5% and the WRAP regional estimate of flaring and venting of 5.07% on Federal Land [Karion et al., GRL, 2013]. Gas wells Oil wells Permitted wells No other large scale activity besides oil and gas production in the area.
Conclusions Atmospheric measurements can provide an independent evaluation of emission inventories. Methane emissions from natural gas operations in some regions in the US may be higher than estimated by regulatory inventories. A significant fraction of emissions could be avoided. Methane is not regulated, however US EPA s New Source Performance Standards for oil and gas operations VOC emissions will have the co- benefit of reducing CH4 emissions. Best management practices if used can reduce emissions. Beyond the question of natural gas GHG emissions, there are some other pressing (related) questions about energy choices, energy equality, climate change mitigation and adaptation at home and around the world.
Resources http://www.garfield-county.com/environmental-health/battlement-mesa- health-impact-assessment-ehms.aspx Risk of Silicosis during well stimulation: Esswein et al, JOEH http://oeh.tandfonline.com/doi/abs/10.1080/15459624.2013.788352#.Uib1jL wmz66 Western Regional Air Partnership Air Emissions from O&G http://www.wrapair2.org/PhaseIII.aspx EPA GHG inventory and GHRP http://www.epa.gov/climatechange/ghgemissions/ Health Impact Assessment: Colorado School of Public Health
No clear path towards zero carbon energy world Globally, consumption of both coal and natural gas is rising! Natural gas is displacing coal in the US for now The Era of fossil energy is still strong! EIA, International Statistics
Time frame for climate benefits of switching to natural gas for various leakage rates Source: Alvarez et al., PNAS, 2012
US EPA CH4 emissions estimates from NG production operations 2010 2011 Reported 2 2012 2013 9 8 7 Tg CH4/yr 6 5 4 3 2 1 0 2005 2006 2007 2008 2009 2010 2011
Conventional and unconventional gas Conventional natural gas deposits have been the most practical and easiest deposits to mine Underground sources of natural gas Unconventional gas refers to gas that is more difficult or less economical to extract. Extraction in the unconventional low permeability formations requires hydraulic fracturing. Source: modified from U.S. Geological Survey Fact Sheet 0113-01 3 Richard Newell, Paris June 2011
Principle of Hydraulic Fracturing Hydraulic fracturing or "fracking" is a stimulation technique used to increase the amount of natural gas or oil that can be extracted from compact formations. Fracking consists in injecting millions of gallons of water mixed with sand (9.5%) and chemical additives (0.5%) down the hole. The high pressure mixture causes the rock layer to crack. The natural gas present in very fine pores can flow to the well head via the fissures which are held open by the sand particles. Source: Total
Example of Oil & Gas Production Source Categories Large Point Sources (Gas plants, compressor stations) Drill Rigs Wellhead Compressor Engines CBM Pump Engines Heaters Pneumatic Devices Condensate and Oil Tanks Dehydrators Completion Venting Source: Tom Moore Western Regional Air Partnership Lateral compressor engines Workover Rigs Salt- Water Disposal Engines Artificial Lift Engines (Pumpjacks) Vapor Recovery Units (VRU s) Miscellaneous or Exempt Engines Flaring Fugitive Emissions Well Blowdowns Truck Loading Amine Units (acid gas removal) Produced Water Tanks Pit and open-top tank Flowback, Utah, 2012 Flowback, CO Front Range, 2013 green completion
Potential Air Impacts of (Shale) Gas/Oil Development: [CH4] going up and 13C going down Likely linked to changes in natural sources NOAA/INSTAAR global network data Climate Forcing Methane Carbon dioxide Global Scale O&G emissions are partly (entirely) responsible for surface O3 pollution events in Colorado Front Range (Uinta Basin, Green River Basin) Schnell et al., 2009; Gilman et al., 2013 Regional Scale Air Quality Ozone Health Potential for increased exposure to carcinogenic compounds esp. during completion (McKenzie et al., 2012) Local-Regional Scale Air Toxics, Ozone Particles Risk of exposure to silica, H2S, PM, O3
Uinta Basin: Many other hydrocarbons are emitted with CH4 February 2012 One area source: oil and gas operations
US Natural Gas Statistics The US became the world s largest gas producer in 2009. 30? 1980s-Today: Advances in horizontal drilling & hydraulic fracturing 1970s-1990s DOE research programs Shale gas and coalbed methane Consumpti on 25? Trillion? Cubic? Feet? 1950s-1960s Buildup of pipeline network 20? 2006-Today Boom in shale gas E&P 15? Late 1990s/Early 2000s Success of Mitchell/Devon Energy in Barnett 10? Ohio historical society 2000-2008 Price of gas increases steeply Shale 5? Dry Production Net Imports 0? 1930? 1940? 1950? 1960? 1970? 1980? 1990? 2000? 2010? Energy Information Administration, 2013 statistics
Dry? Gas? Consump on? (Bcf/yr)? North? America? Eurasia? * Europe? Asia? &? Oceania? Middle? East? Central? &? South? America? Africa? 120000? Dry? Gas? Produc on? (Bcf/yr)? Dry? Gas? Consump on? (Bcf/yr)? 100000? 120000? 120000? 80000? Africa? Africa? 60000? 100000? 100000? 40000? Central? &? South? America? 80000? Central? &? South? America? Middle? East? 20000? 80000? Middle? East? 0? 2000? Asia? &? Oceania? 60000? 2001? 2002? 2003? 2005? 2006? 2007? 2009? 2010? 2011? 2004? 2008? * * 60000? Europe? Asia? &? Oceania? Eurasia? 40000? 40000? Europe? North? America? 20000? 20000? 0? 2000? 0? 2000? 2002? 2004? 2006? 2008? 2010? 2002? 2004? 2006? 2008? 2010? EIA International Statistics


?")