Overview of USF Board of Trustees Fiscal Year 2023-2024 Operating Budget

USF Board of Trustees
June 13, 2023
F
i
s
c
a
l
Y
e
a
r
2
0
2
3
-
2
0
2
4
O
p
e
r
a
t
i
n
g
B
u
d
g
e
t
2
O
b
j
e
c
t
i
v
e
s
•
Impacts on 2023-2024 Operating Budget
•
2023-2024 Operating Budget
•
2023-2024 Educational & General Budget
Priorities
3
P
r
o
p
o
s
e
d
A
c
t
i
o
n
s
1.
Approve the University of South Florida fiscal
year 2023-24 Continuation and Operating
Budgets and;
2.
Authorize the President (or Designee) to
implement state issued budget
amendments or other immaterial changes
during the fiscal year.
F
Y
2
4
O
p
e
r
a
t
i
n
g
B
u
d
g
e
t
C
a
l
e
n
d
a
r
f
o
r
U
S
F
4
I
m
p
a
c
t
s
o
n
F
Y
2
4
B
u
d
g
e
t
6
1.
Record Legislative Session – State Appropriations
a)
$63.3M in recurring resources
b)
$20.8M in non-recurring resources
c)
$47.3M for new equipment and facilities construction
2.
State Performance Based Funding ~$14.2M incremental (49.6M Total State
Investment)
3.
Enrollment and Tuition Collections
4.
Bargained wage increases, internal equity and state-mandated benefit
improvements
5.
Balanced E&G Budget
6.
Cost efficiencies and effectiveness opportunities remain
I
m
p
a
c
t
s
o
n
F
Y
2
4
B
u
d
g
e
t
7
N
e
t
T
u
i
t
i
o
n
C
o
l
l
e
c
t
i
o
n
s
b
y
B
u
d
g
e
t
E
n
t
i
t
y
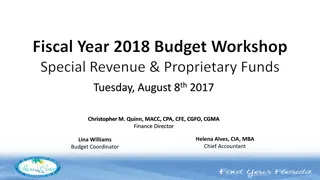
NOTE: All amounts are in thousands
*Forecasted, not yet final
Health SCH excludes Professional Programs
2
0
2
3
-
2
0
2
4
O
p
e
r
a
t
i
n
g
B
u
d
g
e
t
9
F
Y
2
0
2
2
-
2
3
R
e
s
u
l
t
s
NOTES:
Operating Budget Funding Sources exclude Transfers In category from Schedule I because DSO revenues are listed
as a source
USF Financing Corp Revenues were not included as it is primarily a flow through entity
10
F
u
n
d
i
n
g
S
o
u
r
c
e
s
f
o
r
U
n
i
v
e
r
s
i
t
y
o
f
S
o
u
t
h
F
l
o
r
i
d
a
NOTES:
Operating Budget Funding Sources exclude Transfers In category from Schedule I because DSO revenues are
listed as a source
USF Financing Corp Revenues were not included as it is primarily a flow through entity
11
F
Y
2
0
2
3
M
a
j
o
r
S
o
u
r
c
e
D
i
f
f
e
r
e
n
c
e
s
E
x
p
l
a
i
n
e
d
•
State Appropriations
•
$44M – Operational Support
•
$33.3M – Preeminence
•
$14.2M - PBF
•
Contracts & Grants
•
COVID-19 Institutional Federal Funds fully expended in FY23
•
Auxiliaries
•
Post COVID return to operations
•
DSO’s
•
FY24 Plans approved in BOT Finance Committee
12
F
u
n
d
i
n
g
S
o
u
r
c
e
s
f
o
r
U
n
i
v
e
r
s
i
t
y
o
f
S
o
u
t
h
F
l
o
r
i
d
a
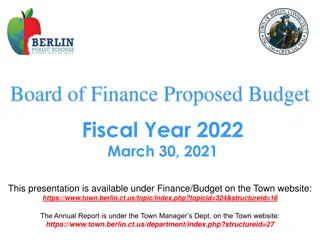
NOTE: All amounts in thousands
$
2
.
6
B
T
o
t
a
l
$
2
.
6
B
T
o
t
a
l
13
O
p
e
r
a
t
i
n
g
B
u
d
g
e
t
S
o
u
r
c
e
s
-
U
n
i
v
e
r
s
i
t
y
o
f
S
o
u
t
h
F
l
o
r
i
d
a
NOTES:
All amounts in thousands
Operating Budget Funding Sources exclude Transfers In category from Schedule I because DSO revenues are listed
as a source
14
F
u
n
d
i
n
g
U
s
e
s
f
o
r
U
n
i
v
e
r
s
i
t
y
o
f
S
o
u
t
h
F
l
o
r
i
d
a
NOTES:
All amounts in thousands
DSO figures exclude amounts transferred to the University as to not double count
2
0
2
2
-
2
0
2
3
E
d
u
c
a
t
i
o
n
&
G
e
n
e
r
a
l
B
u
d
g
e
t
P
r
i
o
r
i
t
i
e
s
16
•
Budget Committee made recommendations to President and
Provost who will review and finalize allocation decisions across all
budget entities
•
All allocations will align with our strategic plan, performance-based
funding and our national ranking aspirations
•
The focus of distributions for FY24 include:
Faculty & Staff Recruitment and Retention
Student Success and Outcomes
Infrastructure Support
S
t
a
t
e
F
u
n
d
i
n
g
f
o
r
U
S
F
a
f
t
e
r
t
h
e
L
e
g
i
s
l
a
t
i
v
e
S
e
s
s
i
o
n
Q
u
e
s
t
i
o
n
s
17
18
P
r
o
p
o
s
e
d
A
c
t
i
o
n
1.
Approve the University of South Florida fiscal
year 2023-24 Continuation and Operating
Budgets and;
2.
Authorize the President (or Designee) to
implement state issued budget
amendments or other immaterial changes
during the fiscal year.
A
P
P
E
N
D
I
C
I
E
S
19
F
Y
2
4
B
u
d
g
e
t
P
r
i
o
r
i
t
i
e
s
P
r
e
s
e
n
t
e
d
a
t
t
h
e
U
S
F
B
O
T
B
u
d
g
e
t
W
o
r
k
s
h
o
p
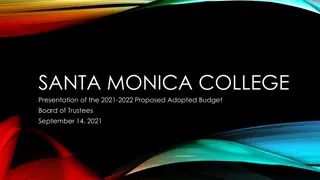
Prasant Mohapatra
Provost & Executive Vice President
April 27, 2023
F
o
c
u
s
e
d
L
i
s
t
o
f
S
t
r
a
t
e
g
i
c
M
e
a
s
u
r
e
s
f
o
r
I
n
s
t
i
t
u
t
i
o
n
a
l
S
u
c
c
e
s
s
21
S
T
U
D
E
N
T
S
U
C
C
E
S
S
•
I
n
c
o
m
i
n
g
s
t
u
d
e
n
t
p
r
o
f
i
l
e
•
A
c
a
d
e
m
i
c
P
r
o
g
r
e
s
s
R
a
t
e
•
C
l
a
s
s
s
i
z
e
<
2
0
•
6
-
y
e
a
r
G
r
a
d
u
a
t
i
o
n
R
a
t
e
f
o
r
F
T
I
C
s
•
3
-
y
e
a
r
g
r
a
d
u
a
t
i
o
n
r
a
t
e
f
o
r
T
r
a
n
s
f
e
r
s
•
B
a
c
h
e
l
o
r
s
e
m
p
l
o
y
e
d
1
y
r
.
p
o
s
t
g
r
a
d
u
a
t
i
o
n
F
A
C
U
L
T
Y
S
U
C
C
E
S
S
•
P
r
o
p
o
r
t
i
o
n
o
f
F
u
l
l
-
T
i
m
e
F
a
c
u
l
t
y
w
i
t
h
h
i
g
h
e
s
t
d
e
g
r
e
e
•
T
o
t
a
l
R
&
D
E
x
p
e
n
d
i
t
u
r
e
s
•
F
e
d
e
r
a
l
R
e
s
e
a
r
c
h
E
x
p
e
n
d
i
t
u
r
e
s
•
F
a
c
u
l
t
y
A
w
a
r
d
s
,
F
e
l
l
o
w
s
h
i
p
s
,
a
n
d
M
e
m
b
e
r
s
h
i
p
s
•
C
i
t
a
t
i
o
n
s
(
C
N
C
I
)
•
A
l
u
m
n
i
G
i
v
i
n
g
&
E
n
d
o
w
m
e
n
t
S
u
m
m
a
r
y
o
f
S
t
r
a
t
e
g
i
c
I
n
v
e
s
t
m
e
n
t
s
•
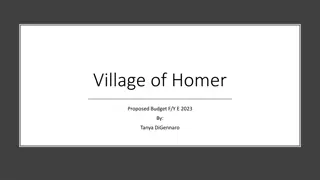
Recruitment and retention of top-quality people (faculty & staff)
•
Student academic progress (quality of curriculum, advisors, mental health & wellness)
•
Infrastructure support (physical & technical)
I
n
v
e
s
t
i
n
g
i
n
I
n
s
t
i
t
u
t
i
o
n
a
l
E
x
c
e
l
l
e
n
c
e
•
I
n
v
e
s
t
i
n
F
a
c
u
l
t
y
&
S
t
a
f
f
R
e
c
r
u
i
t
m
e
n
t
&
R
e
t
e
n
t
i
o
n
•
I
n
v
e
s
t
i
n
S
t
u
d
e
n
t
S
u
c
c
e
s
s
O
u
t
c
o
m
e
s
•
E
n
s
u
r
e
I
n
f
r
a
s
t
r
u
c
t
u
r
e
S
u
p
p
o
r
t
22
P
r
i
o
r
i
t
i
z
e
d
I
n
v
e
s
t
m
e
n
t
s
i
n
I
n
s
t
i
t
u
t
i
o
n
a
l
E
x
c
e
l
l
e
n
c
e
I
n
v
e
s
t
m
e
n
t
s
i
n
F
a
c
u
l
t
y
&
S
t
a
f
f
R
e
c
r
u
i
t
m
e
n
t
&
R
e
t
e
n
t
i
o
n
Recruit world-class faculty with terminal degrees at all levels
Ensure that competitive faculty start-ups are fully supported
Invest in outstanding administrative and technical staff
Invest in Faculty and Staff Success
23
P
r
i
o
r
i
t
i
z
e
d
I
n
v
e
s
t
m
e
n
t
s
i
n
I
n
s
t
i
t
u
t
i
o
n
a
l
E
x
c
e
l
l
e
n
c
e
24
I
n
v
e
s
t
m
e
n
t
s
i
n
S
t
u
d
e
n
t
S
u
c
c
e
s
s
O
u
t
c
o
m
e
s
Improve incoming student profile
Invest in Strategic Enrollment Planning and Management
Invest in academic advisors and in student mental health & wellness
Provide individualized attention to students in small class sizes
Streamline curriculum and optimize modes of delivery
Invest in career readiness of students
P
r
i
o
r
i
t
i
z
e
d
I
n
v
e
s
t
m
e
n
t
s
i
n
I
n
s
t
i
t
u
t
i
o
n
a
l
E
x
c
e
l
l
e
n
c
e
E
n
s
u
r
i
n
g
I
n
f
r
a
s
t
r
u
c
t
u
r
e
S
u
p
p
o
r
t
Develop needed physical facilities (new, deferred maintenance, renovate)
Modernize technological platforms
25
A
r
e
a
s
o
f
O
p
p
o
r
t
u
n
i
t
y
t
o
C
l
o
s
e
G
a
p
s
Richard Sobieray
Senior VP and CFO
April 27, 2023
A
r
e
a
s
o
f
O
p
p
o
r
t
u
n
i
t
y
t
o
C
l
o
s
e
F
u
n
d
i
n
g
G
a
p
-
C
o
m
p
l
e
t
e
d
Growing
revenue and optimizing its distribution through efficiency and effectiveness are
the cornerstones to successfully closing the funding gap.
A
r
e
a
s
o
f
O
p
p
o
r
t
u
n
i
t
y
t
o
C
l
o
s
e
F
u
n
d
i
n
g
G
a
p
–
I
n
P
r
o
c
e
s
s
Growing revenue and optimizing its distribution through efficiency and effectiveness are the
cornerstones to successfully closing the funding gap.
A
r
e
a
s
o
f
O
p
p
o
r
t
u
n
i
t
y
t
o
C
l
o
s
e
F
u
n
d
i
n
g
G
a
p
–
I
n
P
r
o
c
e
s
s
Growing revenue and optimizing its distribution through efficiency and effectiveness are the
cornerstones to successfully closing the funding gap.
F
u
n
d
i
n
g
S
o
u
r
c
e
s
D
e
f
i
n
i
t
i
o
n
s
E
d
u
c
a
t
i
o
n
&
G
e
n
e
r
a
l
D
e
f
i
n
i
t
i
o
n
:
The Education and General (E&G) budget consists of State appropriated General Revenue,
Educational Enhancement (Lottery) funding, and Student Tuition authority.
R
e
s
t
r
i
c
t
i
o
n
s
:
E&G funds are available for use across all of the costs associated with general instruction,
research, public service, plant operations and maintenance, student services, libraries,
administrative support, and other enrollment-related and stand-alone operations of the
university.
Specific components of Tuition Differential have to be spent on Need-Based Financial Aid.
*Additionally, USF provides Education and General Funds toward Financial Aid
31
C
a
r
r
y
f
o
r
w
a
r
d
F
u
n
d
s
32
D
e
f
i
n
i
t
i
o
n
:
Unspent E&G balance that carries into the following year(s)
R
e
s
t
r
i
c
t
i
o
n
s
:
•
7% has to be set aside in BOG Required Reserve
•
Can only be spent on non-recurring expenditures
•
CF Spending plan has to be approved by the Board of Trustees each year
•
Capital Improvement projects can only be funded up to a certain $ limit
C
o
n
t
r
a
c
t
s
&
G
r
a
n
t
s
D
e
f
i
n
i
t
i
o
n
:
The Contracts and Grants (C&G) budget consists of funding from federal agencies, state
agencies, foundations, and private sources that enables the university to conduct specific
research projects or to provide specific non-research services.
•
Contracts & Grants funds include USF sponsored research projects
•
Other Research funds include RIA, F&A, Endowed Chair, and Convenience funds
R
e
s
t
r
i
c
t
i
o
n
s
:
Expenditures to support research grants include:
a)
direct costs such as salaries, wages, and benefits of research personnel, materials, supplies,
travel, equipment, and rental of space that are directly attributed to the research project, and
b)
i
n
d
i
r
e
c
t
c
o
s
t
s
s
u
c
h
a
s
b
u
i
l
d
i
n
g
a
n
d
e
q
u
i
p
m
e
n
t
u
s
e
a
n
d
d
e
p
r
e
c
i
a
t
i
o
n
,
p
h
y
s
i
c
a
l
p
l
a
n
t
a
n
d
m
a
i
n
t
e
n
a
n
c
e
,
h
a
z
a
r
d
o
u
s
w
a
s
t
e
d
i
s
p
o
s
a
l
,
l
i
b
r
a
r
i
e
s
,
g
e
n
e
r
a
l
a
d
m
i
n
i
s
t
r
a
t
i
o
n
c
o
s
t
s
(
l
e
g
a
l
,
p
u
r
c
h
a
s
i
n
g
,
a
c
c
o
u
n
t
i
n
g
)
,
j
a
n
i
t
o
r
i
a
l
s
e
r
v
i
c
e
s
,
a
n
d
u
t
i
l
i
t
i
e
s
.
33
A
u
x
i
l
i
a
r
y
E
n
t
e
r
p
r
i
s
e
s
34
D
e
f
i
n
i
t
i
o
n
:
T
h
e
A
u
x
i
l
i
a
r
y
E
n
t
e
r
p
r
i
s
e
s
c
o
n
s
i
s
t
o
f
u
n
i
v
e
r
s
i
t
y
b
u
s
i
n
e
s
s
o
p
e
r
a
t
i
o
n
s
t
h
a
t
a
r
e
s
e
l
f
-
s
u
p
p
o
r
t
i
n
g
t
h
r
o
u
g
h
u
s
e
r
f
e
e
s
,
p
a
y
m
e
n
t
s
a
n
d
c
h
a
r
g
e
s
.
T
y
p
e
s
o
f
A
u
x
i
l
i
a
r
i
e
s
:
•
Auxiliaries with Bond Financed Facilities
•
Other Auxiliaries
R
e
s
t
r
i
c
t
i
o
n
s
:
A
u
x
i
l
i
a
r
i
e
s
a
r
e
r
e
q
u
i
r
e
d
b
y
B
o
a
r
d
R
e
g
u
l
a
t
i
o
n
t
o
b
e
s
e
l
f
-
s
u
p
p
o
r
t
i
n
g
a
n
d
a
r
e
r
e
v
i
e
w
e
d
b
y
e
x
t
e
r
n
a
l
e
n
t
i
t
i
e
s
o
n
a
p
e
r
i
o
d
i
c
b
a
s
i
s
t
o
e
n
s
u
r
e
c
o
m
p
l
i
a
n
c
e
L
o
c
a
l
F
u
n
d
s
D
e
f
i
n
i
t
i
o
n
:
Funding sources for university operating units that include Student Activities, Financial
Aid, Concessions, Intercollegiate Athletics, Technology Fee, Board-Approved Fees, and
university Self-Insurance Plans
R
e
s
t
r
i
c
t
i
o
n
s
:
Each of the above categories has their own restrictions
35
L
o
c
a
l
F
u
n
d
s
F
i
n
a
n
c
i
a
l
A
i
d
:
The Student Financial Aid budget consists of funding from student financial aid fees, support
from federal and state financial aid awards, institutional programs, and private scholarships.
•
Funding is provided for a specific purpose and/or a specific student/program
•
Funds provided for financial aid that are not for specific student/program are managed by
Financial Aid Policy Advisory Committee (FAPAC)
A
t
h
l
e
t
i
c
s
:
The Athletics Operating budget supports the university’s student athletics program. Funding is
generated from student athletics fees as well as ticket sales to athletics events, game
guarantees, NCAA distributions, sponsorships and private support. Intercollegiate Athletics is
also supported by Title IX funding, waivers and scholarships, and a statutory tax on ticket
sales to support women’s sports.
36
L
o
c
a
l
F
u
n
d
s
S
t
u
d
e
n
t
A
c
t
i
v
i
t
i
e
s
(
a
k
a
A
c
t
i
v
i
t
y
&
S
e
r
v
i
c
e
)
F
e
e
:
The Activity and Service budget consists of funds from the student Activity and Service (A&S) fee
to support Student Affairs operations, student government operations, student activities such as
clubs and organizations, student centers, and recreational sports for all campuses.
T
e
c
h
n
o
l
o
g
y
F
e
e
:
The fee revenues are used to enhance instructional technology resources for students and
faculty.
B
o
a
r
d
A
p
p
r
o
v
e
d
F
e
e
s
:
Board Approved Fees are fees specific to the university and have been approved by the Board of
Governors (Regulation 7.003(23)). The only such fee for USF is the Green Fee that funds
sustainability projects on campus and is managed by a group of students and faculty.
37
L
o
c
a
l
F
u
n
d
s
S
e
l
f
-
I
n
s
u
r
a
n
c
e
:
T
h
e
s
e
a
r
e
r
e
v
e
n
u
e
s
r
e
c
e
i
v
e
d
b
y
t
h
e
u
n
i
v
e
r
s
i
t
y
t
o
f
u
n
d
a
s
e
l
f
-
i
n
s
u
r
a
n
c
e
p
r
o
g
r
a
m
f
o
r
m
e
d
i
c
a
l
s
c
h
o
o
l
s
,
i
n
c
l
u
d
i
n
g
t
h
e
F
a
c
u
l
t
y
P
r
a
c
t
i
c
e
P
l
a
n
s
.
T
h
e
r
e
s
h
a
l
l
b
e
n
o
s
t
a
t
e
f
u
n
d
s
a
p
p
r
o
p
r
i
a
t
e
d
t
o
a
s
e
l
f
-
i
n
s
u
r
a
n
c
e
p
r
o
g
r
a
m
(
C
h
a
p
t
e
r
1
0
0
4
.
2
4
(
3
)
F
l
o
r
i
d
a
S
t
a
t
u
t
e
s
)
.
C
o
n
c
e
s
s
i
o
n
s
:
The Concessions fund contains all the commission-based revenues from beverage and pouring, snack
vending, as well as student housing laundry machines. The commission revenues are used to support the
purchase of food and refreshment items at university-wide events, faculty and staff recruitment,
commencements, training, lecture series, board of trustees, student housing socials and convocation
events. Funds shall not be expended for the construction or reconstruction of buildings except as
provided under s. 1013.74 F.S.
38
D
i
r
e
c
t
S
u
p
p
o
r
t
O
r
g
a
n
i
z
a
t
i
o
n
F
u
n
d
s
39
D
e
f
i
n
i
t
i
o
n
:
Per Florida Statute 1004.28 (1)(a), “University direct-support organization” means an
organization which is:
•
A Florida corporation not for profit incorporated under the provisions of chapter 617 and
approved by the Department of State.
•
Organized and operated exclusively to receive, hold, invest, and administer property and to
make expenditures to or for the benefit of a state university in Florida or for the benefit of a
research and development park or research and development authority affiliated with a state
university and organized under part V of chapter 159.”
R
e
s
t
r
i
c
t
i
o
n
s
:
S
i
m
i
l
a
r
t
o
A
u
x
i
l
i
a
r
y
E
n
t
e
r
p
r
i
s
e
s
,
D
S
O
’
s
m
u
s
t
b
e
s
e
l
f
-
s
u
p
p
o
r
t
i
n
g
;
t
h
e
k
e
y
d
i
s
t
i
n
c
t
i
o
n
i
s
t
h
a
t
D
S
O
’
s
a
r
e
f
o
r
m
a
l
l
y
i
n
c
o
r
p
o
r
a
t
e
d
.
D
S
O
’
s
i
n
c
l
u
d
e
:
40
•
Faculty Practice Plan (UMSA)
•
USF Alumni Association
•
USF Foundation
•
USF Health Professions Conferencing
•
USF Institute of Applied Engineering
•
USF Research Foundation
•
Sun Dome
NOTE: USF Financing Corp Revenues were not included as it is primarily a flow through entity. It does have immaterial revenues related to the
ownership interest in INTO which is primarily Tampa related, but since these amounts are immaterial on the Financing Corp financial statements, they
were not included in the presentation.
Explore the details of the University of South Florida Board of Trustees' Fiscal Year 2023-2024 Operating Budget, including objectives, proposed actions, impacts, budget calendar, and projections. The budget covers various aspects such as state appropriations, tuition collections, budget entity allocations, and financial plans for different campuses.

Download Presentation

Please find below an Image/Link to download the presentation.
The content on the website is provided AS IS for your information and personal use only. It may not be sold, licensed, or shared on other websites without obtaining consent from the author. Download presentation by click this link. If you encounter any issues during the download, it is possible that the publisher has removed the file from their server.
E N D
Presentation Transcript
Fiscal Year 2023-2024 Operating Budget USF Board of Trustees June 13, 2023
Objectives Impacts on 2023-2024 Operating Budget 2023-2024 Operating Budget 2023-2024 Educational & General Budget Priorities 2
Proposed Actions 1. Approve the University of South Florida fiscal year 2023-24 Continuation and Operating Budgets and; 2. Authorize the President (or Designee) to implement state issued budget amendments or other immaterial changes during the fiscal year. 3
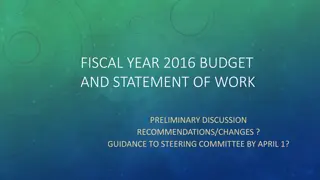
FY24 Operating Budget Calendar for USF June 30, 2023 August 18, 2023 BOT Meeting BOT Meeting Allocation Details Presented CF and FCO Plans Approved August, CF and FCO Plans submitted to the Board of Governors President and Provost Meetings Allocation decisions finalized and communicated FY24 Continuation and Operating Budgets Approved June 13, Operating Budget Submitted to the Board of Governors October 2, 2023 2023 2023 4
Impacts on FY24 Budget 1. Record Legislative Session State Appropriations a) $63.3M in recurring resources b) $20.8M in non-recurring resources c) $47.3M for new equipment and facilities construction State Performance Based Funding ~$14.2M incremental (49.6M Total State Investment) Enrollment and Tuition Collections Bargained wage increases, internal equity and state-mandated benefit improvements Balanced E&G Budget Cost efficiencies and effectiveness opportunities remain 2. 3. 4. 5. 6. 6
Net Tuition Collections by Budget Entity Budget Entity 2019 179,784.8 $ 181,454.1 $ 902,192 52,464.3 $ 56,801.5 $ 130,812 16,223.7 $ 20,490.0 $ 120,945 7,415.1 $ 9,943.4 $ 255,887.9 $ 268,688.9 $ 1,213,731 2020 179,784.8 $ 178,622.2 $ 901,669 56,732.1 $ 58,770.4 $ 142,231 16,070.4 $ 19,249.3 $ 114,315 8,787.8 $ 10,061.1 $ 261,375.0 $ 266,703.0 $ 1,221,047 2021 179,784.8 175,709.8 905,523 58,492.8 60,780.0 156,230 16,748.5 18,623.7 105,507 8,965.3 11,642.5 70,272 263,991.3 266,756.1 1,237,532 2022 179,784.8 175,419.8 871,632 60,427.9 62,128.1 160,344 16,959.1 19,733.8 105,245 8,399.1 13,744.8 73,286 265,570.8 271,026.4 1,210,507 2023* 179,784.8 $ 183,115.1 $ 60,292.8 $ 62,010.8 $ 18,082.5 $ 19,939.4 $ $ 14,235.7 $ 267,674.9 $ 279,300.9 $ 1,225,940 2024 Projection 179,784.8 $ 185,000.0 $ Distributed Budget Collections Fundable SCH Distributed Budget Collections Fundable SCH** Distributed Budget Collections Fundable SCH Distributed Budget Collections Fundable SCH Distributed Budget Collections Fundable SCH $ $ $ $ $ $ $ $ $ $ $ $ $ $ $ $ $ $ $ $ Tampa 891,563 $ $ 60,292.8 63,000.0 Health 158,884 $ $ 18,082.5 21,000.0 St Pete 101,583 9,514.9 $ $ 9,514.9 14,000.0 Sarasota 59,782 62,832 73,910 $ $ 267,674.9 283,000.0 USF Total NOTE: All amounts are in thousands *Forecasted, not yet final Health SCH excludes Professional Programs 7
FY 2022-23 Results FY23 Forecasted Actuals Variance FY23 Plan Total Sources (in Thousands) $ % Student Tuition State Appropriations Contracts and Grants Auxiliaries Local Funds Faculty Practice Plan - DSO TOTAL Operating Budget Funding Sources USF Alumni Association USF Foundation, Inc. USF Health Professions Conferencing Corp USF Institute of Applied Engineering, Inc. USF Research Foundation, Inc. Sun Dome, Inc. DSO (excl Faculty Practice Plan) Sources Total Sources $ 290,899 524,522 407,016 253,545 461,598 367,528 2,305,108 3,164 128,205 16,784 17,890 15,033 2,156 183,232 2,488,340 $ 279,301 524,522 381,120 249,333 458,257 377,382 2,269,915 3,218 108,296 15,387 14,812 13,171 2,352 157,236 2,427,151 $ (11,598) -4.0% 0.0% -6.4% -1.7% -0.7% 2.7% -1.5% 1.7% -15.5% -8.3% -17.2% -12.4% 9.1% -14.2% -2.5% (0) (25,895) (4,212) (3,341) 9,854 (35,193) 54 (19,909) (1,397) (3,078) (1,862) 196 (25,996) (61,189) NOTES: Operating Budget Funding Sources exclude Transfers In category from Schedule I because DSO revenues are listed as a source USF Financing Corp Revenues were not included as it is primarily a flow through entity 9
Funding Sources for University of South Florida FY24 Pending Adjustments Variance FY23 Plan FY24 Plan Total Sources (in Thousands) Continuation $ % Student Tuition State Appropriations Contracts and Grants Auxiliaries Local Funds Faculty Practice Plan - DSO TOTAL Operating Budget Funding Sources USF Alumni Association USF Foundation, Inc. USF Health Professions Conferencing Corp USF Institute of Applied Engineering, Inc. USF Research Foundation, Inc. Sun Dome, Inc. DSO (excl Faculty Practice Plan) Sources Total Sources NOTES: Operating Budget Funding Sources exclude Transfers In category from Schedule I because DSO revenues are listed as a source USF Financing Corp Revenues were not included as it is primarily a flow through entity $ 290,899 524,522 407,016 253,545 461,598 367,528 2,305,108 3,164 128,205 16,784 17,890 15,033 2,156 183,232 2,488,340 $ 283,000 514,522 402,758 268,732 469,952 393,353 2,332,318 3,212 139,256 21,616 13,550 14,027 2,443 194,104 2,526,422 $ - $ 283,000 606,018 402,758 268,732 469,952 393,353 2,423,813 3,212 139,256 21,616 13,550 14,027 2,443 194,104 2,617,917 $ (7,899) 81,496 (4,258) 15,187 8,354 25,825 118,705 -2.7% 15.5% -1.0% 6.0% 1.8% 7.0% 5.1% 1.5% 8.6% 28.8% -24.3% -6.7% 13.3% 5.9% 5.2% 91,496 - - - - 91,496 - - - - - - - 48 11,051 4,832 (4,340) (1,006) 287 10,872 129,577 91,496 10
FY 2023 Major Source Differences Explained State Appropriations $44M Operational Support $33.3M Preeminence $14.2M - PBF Contracts & Grants COVID-19 Institutional Federal Funds fully expended in FY23 Auxiliaries Post COVID return to operations DSO s FY24 Plans approved in BOT Finance Committee 11
Funding Sources for University of South Florida Health $922,135 35% $2.6B Total $2.6B Total St. Petersburg Campus $94,111 4% Sarasota-Manatee Campus $47,124 2% Tampa Campus (less Health) $1,463,020 56% Unallocated $91,527 3% NOTE: All amounts in thousands 12
Operating Budget Sources - University of South Florida FY24 Plan Restricted: Student Tuition/Need-Based Aid State Appropriations - Specific Appropriations Contracts and Grants Auxiliaries Local Funds DSOs Restricted Unrestricted: Student Tuition State Appropriations Unrestricted TOTAL Sources $ 16,189 39,634 402,758 268,732 469,952 587,457 1,784,724 267,612 565,582 833,194 2,617,917 NOTES: All amounts in thousands Operating Budget Funding Sources exclude Transfers In category from Schedule I because DSO revenues are listed as a source 13
Funding Uses for University of South Florida FY23 Forecasted Actuals Variance FY24 Continuation Budget Pending Adjustments Variance FY23 Plan FY24 Plan Budgeted Expenses (in Thousands) Salaries and Benefits Other Personal Services Expenses Operating Capital Outlay Risk Management Financial Aid Debt Service Library Resources Unallocated TOTAL Operating Budget Expenses USF Alumni Association USF Foundation, Inc. USF Health Professions Conferencing Corp USF Institute of Applied Engineering, Inc. USF Research Foundation, Inc. Sun Dome, Inc. DSO (excl Faculty Practice Plan) Sources* TOTAL University Expenses $ % $ % $ 1,086,585 134,424 1,078,373 7,658 6,176 14,183 3,335 9,179 $ 1,203,045 152,704 873,705 7,542 8,342 16,111 $ (116,460) (18,280) 204,667 -10.7% -13.6% 19.0% 1.5% -35.1% -13.6% 81.3% 17.1% $ 1,181,090 155,308 1,045,932 12,761 6,632 16,189 2,118 9,179 $ - - - - - - - - $ 1,181,090 155,308 1,045,932 12,761 6,632 16,189 2,118 9,179 91,496 2,520,705 1,882 13,064 15,038 8,030 13,318 1,964 53,295 2,574,000 $ 94,505 20,884 (32,440) 5,103 457 2,006 (1,218) 8.7% 15.5% -3.0% 66.6% 7.4% 14.1% -36.5% 0.0% 115 (2,167) (1,928) 2,712 1,567 - 70,227 (27) (825) 971 1,419 825 (148) 2,215 72,442 623 7,612 - - - - 91,496 91,496 91,496 180,792 2,339,913 1,861 12,527 11,019 9,815 13,326 1,734 50,283 2,390,195 2,269,686 1,888 13,352 10,048 8,396 12,502 1,882 48,067 2,317,753 3.0% -1.4% -6.6% 8.8% 14.5% 6.2% -8.5% 4.4% 3.0% 2,429,209 1,882 13,064 15,038 8,030 13,318 1,964 53,295 2,482,505 7.7% 1.1% 4.3% 36.5% -18.2% -0.1% 13.3% 6.0% 7.7% - - - - - - - 21 537 4,019 (1,785) (8) 230 3,013 183,805 91,496 NOTES: All amounts in thousands DSO figures exclude amounts transferred to the University as to not double count 14
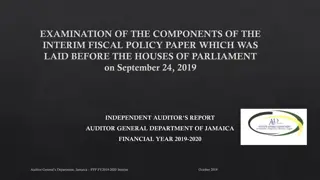
2022-2023 Education & General Budget Priorities
State Funding for USF after the Legislative Session Budget Committee made recommendations to President and Provost who will review and finalize allocation decisions across all budget entities All allocations will align with our strategic plan, performance-based funding and our national ranking aspirations The focus of distributions for FY24 include: Faculty & Staff Recruitment and Retention Student Success and Outcomes Infrastructure Support 16
Questions 17
Proposed Action 1. Approve the University of South Florida fiscal year 2023-24 Continuation and Operating Budgets and; 2. Authorize the President (or Designee) to implement state issued budget amendments or other immaterial changes during the fiscal year. 18
APPENDICIES 19
FY 24 Budget Priorities Presented at the USF BOT Budget Workshop Prasant Mohapatra Provost & Executive Vice President April 27, 2023
Focused List of Strategic Measures for Institutional Success STUDENT SUCCESS FACULTY SUCCESS Incoming student profile Academic Progress Rate Class size <20 6-year Graduation Rate for FTICs 3-year graduation rate for Transfers Bachelors employed 1 yr. post graduation Proportion of Full-Time Faculty with highest degree Total R&D Expenditures Federal Research Expenditures Faculty Awards, Fellowships, and Memberships Citations (CNCI) Alumni Giving & Endowment Summary of Strategic Investments Recruitment and retention of top-quality people (faculty & staff) Student academic progress (quality of curriculum, advisors, mental health & wellness) Infrastructure support (physical & technical) 21
Investing in Institutional Excellence Invest in Faculty & Staff Recruitment & Retention Invest in Student Success Outcomes Ensure Infrastructure Support 22
Prioritized Investments in Institutional Excellence Investments in Faculty & Staff Recruitment & Retention Recruit world-class faculty with terminal degrees at all levels Ensure that competitive faculty start-ups are fully supported Invest in outstanding administrative and technical staff Invest in Faculty and Staff Success 23
Prioritized Investments in Institutional Excellence Investments in Student Success Outcomes Improve incoming student profile Invest in Strategic Enrollment Planning and Management Invest in academic advisors and in student mental health & wellness Provide individualized attention to students in small class sizes Streamline curriculum and optimize modes of delivery Invest in career readiness of students 24
Prioritized Investments in Institutional Excellence Ensuring Infrastructure Support Develop needed physical facilities (new, deferred maintenance, renovate) Modernize technological platforms 25
Areas of Opportunity to Close Gaps Richard Sobieray Senior VP and CFO April 27, 2023
Areas of Opportunity to Close Funding Gap - Completed Growingrevenue and optimizing its distribution through efficiency and effectiveness are the cornerstones to successfully closing the funding gap. Decisions Completed Opportunity Status The university desired a new budget model that was transparent, predictable and moved it in the direction of tying investments to our strategic plan, rankings, performance-based funding and AAU membership. The new model has been implemented. Future improvements will be made through the RCM implementation. Energy service companies (ESCOs) are companies that offer energy services to customers, such as implementing energy-efficiency projects, reducing energy costs, and arranging financing for energy systems. ESCOs use the performance-based contracting methodology, which means their compensation is linked to the actual energy savings achieved. USF has finalized their ESCO with Siemens. Estimated value: $47M over 20 years An ITN for banking services was completed and all lots were awarded to JP Morgan Chase to optimize pricing of banking fees and procurement card rebate. Estimated value: $3M annually 1. Budget Model Process 2. ESCO JP Morgan Chase Banking 3.
Areas of Opportunity to Close Funding Gap In Process Growing revenue and optimizing its distribution through efficiency and effectiveness are the cornerstones to successfully closing the funding gap. Decisions Initial Recommendation In Discussion Pending Discussion Opportunity Status Delivery Date Improving net tuition is primarily two-fold: 1) changing enrollment strategies and 2) optimizing discount strategies. Ruffalo Noel Levitz (RNL) has been engaged to address the university s enrollment and discounting strategies. Target: $15M - $20M increase Having an effective research structure and funds flow model are critical elements for incentivizing the growth in research. Initial recommendations for both structure and funds flow are completed. Socialization has begun. Target: $50M - $100M increase The top R1 universities rely on a large endowment to in part support its student scholarship and research enterprise. USF s endowment size gap compared to AAU and top-25 universities as at least $1B. Target: TBD The university has assessed the viability of monetizing a lease currently executed for broadband access. Recommendations are completed and the process for securing this option has begun. Target: $25M - $40M The university engaged Morgan Stanley in an initial assessment of the potential opportunity for monetizing the parking and housing revenue stream. As a result, a Parking Task Force has just been established to determine its feasibility. A Housing Task Force will follow. Target: $400M - $600M 9.30.2023 1. Improving Net Tuition Increasing Contracts and Grants 3.31.2023 2. TBD 3. Philanthropy Growth Financing Strategies - Broadband 2.24.2023 4. Financing Strategies Parking and Housing 9.30.2023/ 12.31.2023 5.
Areas of Opportunity to Close Funding Gap In Process Growing revenue and optimizing its distribution through efficiency and effectiveness are the cornerstones to successfully closing the funding gap. Decisions Initial Recommendation In Discussion Pending Discussion Opportunity Status Delivery Date RCM provides a foundation for analysis including funds flow, portfolio, margin, service cost and strategic investment/subvention. This means it provides the university with better insight on how invested resources provide a high academic return relative to their net costs. Realizing academic efficiencies is one approach to optimizing revenue distribution. Instructional capacity analysis surfaces under-filled classes, small classes and under-utilized instructional capacity. EAB has been engaged to assist with this analysis. Work beginning end of April. Target: TBD Academic Program Assessment develops a program portfolio review rubric and surfaces opportunities to start new programs, revitalize current programs or eliminate low-performing programs. In discussion with Gray & Associates to implement their technology and consulting services. Target: TBD Effective transformation requires an enterprise-wide approach to improve and enhance organizational models, operating processes, technology, leadership and talent models. A consultant is being considered to assist through this process, including a zero-based budget for FY2025 to ensure maximal efficiency and effectiveness. Target: TBD The university is funneling resources into its physical campus, but it s still not enough to keep up or much less advance future strategy. The university should consider repurposing space to meet evolving needs and minimize costs. Target: TBD Responsibility Center Management 6.30.2023 6. College Performance Instructional Capacity 12.31.2023 7. College Performance Academic Program Assessment 6.30.2024 8. Administrative Efficiency 6.30.2024 9. 6.30.2024 10. Space Optimization
Education & General Definition: The Education and General (E&G) budget consists of State appropriated General Revenue, Educational Enhancement (Lottery) funding, and Student Tuition authority. Restrictions: E&G funds are available for use across all of the costs associated with general instruction, research, public service, plant operations and maintenance, student services, libraries, administrative support, and other enrollment-related and stand-alone operations of the university. Specific components of Tuition Differential have to be spent on Need-Based Financial Aid. *Additionally, USF provides Education and General Funds toward Financial Aid 31
CarryforwardFunds Definition: Unspent E&G balance that carries into the following year(s) Restrictions: 7% has to be set aside in BOG Required Reserve Can only be spent on non-recurring expenditures CF Spending plan has to be approved by the Board of Trustees each year Capital Improvement projects can only be funded up to a certain $ limit 32
Contracts & Grants Definition: The Contracts and Grants (C&G) budget consists of funding from federal agencies, state agencies, foundations, and private sources that enables the university to conduct specific research projects or to provide specific non-research services. Contracts & Grants funds include USF sponsored research projects Other Research funds include RIA, F&A, Endowed Chair, and Convenience funds Restrictions: Expenditures to support research grants include: a) direct costs such as salaries, wages, and benefits of research personnel, materials, supplies, travel, equipment, and rental of space that are directly attributed to the research project, and b) indirect costs such as building and equipment use and depreciation, physical plant and maintenance, hazardous waste disposal, libraries, general administration costs (legal, purchasing, accounting), janitorial services, and utilities. 33
Auxiliary Enterprises Definition: The Auxiliary Enterprises consist of university business operations that are self- supporting through user fees, payments and charges. Types of Auxiliaries: Auxiliaries with Bond Financed Facilities Other Auxiliaries Restrictions: Auxiliaries are required by Board Regulation to be self-supporting and are reviewed by external entities on a periodic basis to ensure compliance 34
Local Funds Definition: Funding sources for university operating units that include Student Activities, Financial Aid, Concessions, Intercollegiate Athletics, Technology Fee, Board-Approved Fees, and university Self-Insurance Plans Restrictions: Each of the above categories has their own restrictions 35
Local Funds Financial Aid: The Student Financial Aid budget consists of funding from student financial aid fees, support from federal and state financial aid awards, institutional programs, and private scholarships. Funding is provided for a specific purpose and/or a specific student/program Funds provided for financial aid that are not for specific student/program are managed by Financial Aid Policy Advisory Committee (FAPAC) Athletics: The Athletics Operating budget supports the university s student athletics program. Funding is generated from student athletics fees as well as ticket sales to athletics events, game guarantees, NCAA distributions, sponsorships and private support. Intercollegiate Athletics is also supported by Title IX funding, waivers and scholarships, and a statutory tax on ticket sales to support women s sports. 36
Local Funds Student Activities (aka Activity & Service) Fee: The Activity and Service budget consists of funds from the student Activity and Service (A&S) fee to support Student Affairs operations, student government operations, student activities such as clubs and organizations, student centers, and recreational sports for all campuses. Technology Fee: The fee revenues are used to enhance instructional technology resources for students and faculty. Board Approved Fees: Board Approved Fees are fees specific to the university and have been approved by the Board of Governors (Regulation 7.003(23)). The only such fee for USF is the Green Fee that funds sustainability projects on campus and is managed by a group of students and faculty. 37
Local Funds Self-Insurance: These are revenues received by the university to fund a self-insurance program for medical schools, including the Faculty Practice Plans. There shall be no state funds appropriated to a self-insurance program (Chapter 1004.24(3) Florida Statutes). Concessions: The Concessions fund contains all the commission-based revenues from beverage and pouring, snack vending, as well as student housing laundry machines. The commission revenues are used to support the purchase of food and refreshment items at university-wide events, faculty and staff recruitment, commencements, training, lecture series, board of trustees, student housing socials and convocation events. Funds shall not be expended for the construction or reconstruction of buildings except as provided under s. 1013.74 F.S. 38
Direct Support Organization Funds Definition: Per Florida Statute 1004.28 (1)(a), University direct-support organization means an organization which is: A Florida corporation not for profit incorporated under the provisions of chapter 617 and approved by the Department of State. Organized and operated exclusively to receive, hold, invest, and administer property and to make expenditures to or for the benefit of a state university in Florida or for the benefit of a research and development park or research and development authority affiliated with a state university and organized under part V of chapter 159. Restrictions: Similar to Auxiliary Enterprises, DSO s must be self-supporting; the key distinction is that DSO s are formally incorporated. 39
DSOs include: Faculty Practice Plan (UMSA) USF Alumni Association USF Foundation USF Health Professions Conferencing USF Institute of Applied Engineering USF Research Foundation Sun Dome NOTE: USF Financing Corp Revenues were not included as it is primarily a flow through entity. It does have immaterial revenues related to the ownership interest in INTO which is primarily Tampa related, but since these amounts are immaterial on the Financing Corp financial statements, they were not included in the presentation. 40