Analysis of Global Commodity Export Dependence Trends 2013-2017
The analysis includes data from the State of Commodity Dependence 2019 PDF, focusing on the degree of commodity export dependence of countries worldwide from 2013 to 2017. It examines specific countries falling into different percentage categories and explores the factors contributing to their positioning. Additionally, the document discusses the changes in commodity dependence over the past two decades and highlights the evolution of exports for countries like Brazil and Rwanda during the period.

Download Presentation

Please find below an Image/Link to download the presentation.
The content on the website is provided AS IS for your information and personal use only. It may not be sold, licensed, or shared on other websites without obtaining consent from the author. Download presentation by click this link. If you encounter any issues during the download, it is possible that the publisher has removed the file from their server.
E N D
Presentation Transcript
Use the State of Commodity Dependence 2019 PDF to complete the chart and questions for slides 3-7
Figure 1. Degree of commodity export dependence of all countries in the world, 2013-2017 (percentages) In the chart below list six countries found in each of the five categories 0-20 % 20-40 % 40-60 % 60-80 % 80-100 % 1 1 1 1 1 2 2 2 2 2 3 3 3 3 3 4 4 4 4 4 5 5 5 5 5 6 6 6 6 6 1. 1.1. What do most of the countries 1-40 have in common? Which countries would be an exception? 2. What do most of the countries 80-100 have in common? Which countries would be an exception? 3. Why is China in the 0-20 category? 4. Why is Australia in the 80-100 category? 5. Why isn t the USA in the 0-20 category? 6. Why is Canada in the 40-60 category? 7. Why is Mexico in the 0-20 category? How does its geography help it?
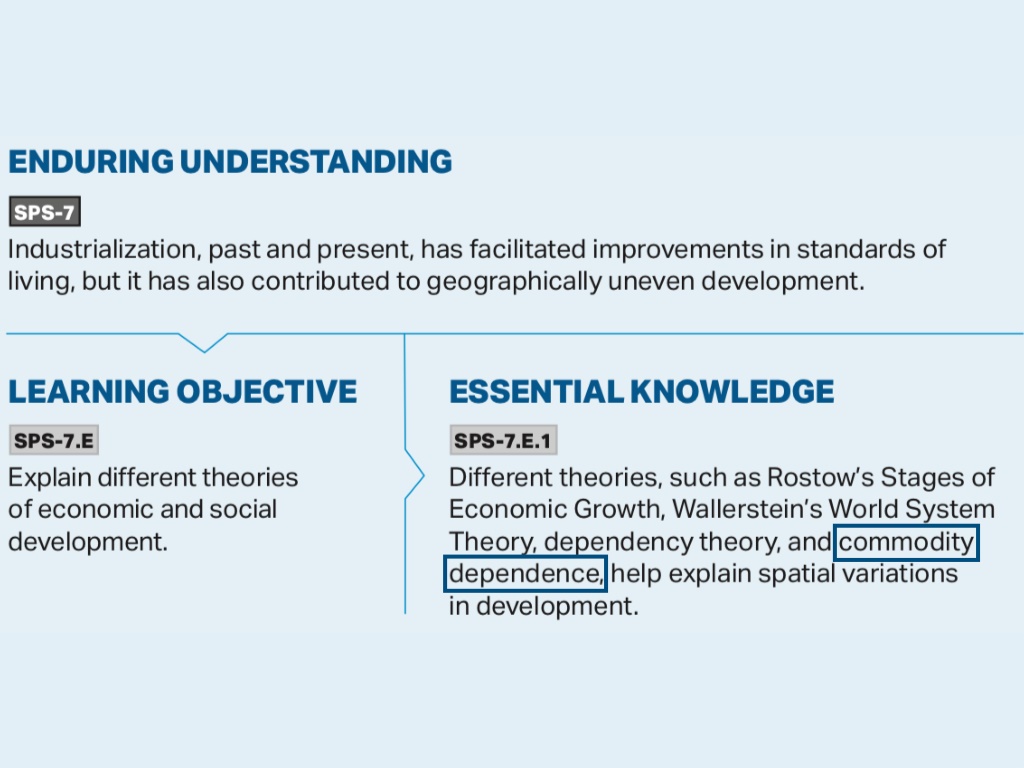
1. Summarize the Introduction on iv (page 5 of the PDF). 2. Describe Figure 2. Distribution of commodity-dependent countries by geographic region, 2013-2017. 3. Explain the title on page 5 (page 12 of the PDF). 4. Explain how the number of commodity-dependent countries changed over the past 20 years. 5. Explain the title on page 7 (page 14 of the PDF) 6. How has Brazil s exports changed from 1998 to 2017? (page 14 or page 21 of the PDF) 7. How has Rwanda s exports changed from 1998 to 2017? (page 14 or page 21 of the PDF)
Using the charts for each selected country from Chapter 2 Country Statistical Profiles complete the chart below. The first country is completed as an example. Selected Countries Leading Commodity Group Exported What is an example of this exported commodity? [057] Fruits and nuts (excluding oil nuts), fresh or dried p. 100 (page 107 of PDF) You will need to research an example from internet Bananas is the main example. Guatamala Ethiopia Kenya Madagascar Cote d ivoire Afghanistan Uruguay Senegal Uganda New Zealand
Using the charts for each selected country from Chapter 2 Country Statistical Profiles complete the chart below. The first country is completed as an example. Selected Countries Leading Commodity Group Exported What is an example of this exported commodity? Fiji Myanmar Trinidad and Tobago Columbia Venezuela Algeria Nigeria Angola Russia Kazakhstan
Using the charts for each selected country from Chapter 2 Country Statistical Profiles complete the chart below. The first country is completed as an example. Selected Countries Leading Commodity Group Exported What is an example of this exported commodity? Norway Saudi Arabia Jamaica Peru Chile Niger Mali Botswana Mozambique Australia
Slides 5-7 can be divided among group members.


.")