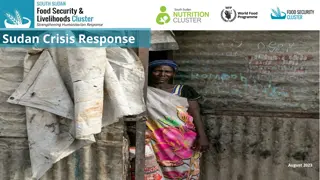
Multi-Sectoral Assistance in Maban County Refugee Camps, South Sudan

Providing crucial multi-sectoral assistance to four Sudanese refugee camps in Maban County, South Sudan, with a total refugee population of 171,839. ACTED, in partnership with UNHCR, focuses on water, sanitation, hygiene, and COVID-19 prevention. Objectives include improving water access and quality, promoting good hygiene practices, and assessing overall program satisfaction. The assessment report outlines key indicators and challenges, aiming to enhance services for the refugee communities.

Download Presentation

Please find below an Image/Link to download the presentation.
The content on the website is provided AS IS for your information and personal use only. It may not be sold, licensed, or shared on other websites without obtaining consent from the author. Download presentation by click this link. If you encounter any issues during the download, it is possible that the publisher has removed the file from their server.
E N D
Presentation Transcript
WASH ASSESSMENT - August 2021 - Providing multi-sectoral assistance to refugee camps in Maban county, South Sudan WASH COMMITTEE TRAINING IN DORO CAMP, MAY 2021 Demonstration Plot in Demonstration Plot in Gendrassa Gendrassa, October 2020 , October 2020 Robert SIMPSON, Country Director - robert.simpson@acted.org Valentine JOLY, Project Development Manager valentine.joly@acted.org ACTED in South Sudan, Hai Cinema, Juba
WASH ASSESSMENT REPORT Providing multi-sectoral assistance to refugee camps in Maban county, South Sudan August 2021 Maban, in Upper Nile State, is home to the four Sudanese refugee camps of Doro, Kaya, Gendrassa and Yusuf Batil, with a total refugee population of 171,839 (December 2021). As a result of violent tensions in neighboring Blue Nile State across the border of Sudan in 2011, a significant number of Sudanese refugees were displaced and sought refuge in South Sudan. Although a peace deal was signed in Blue Nile in August 2020, the refugee population is expected to remain in South Sudan for the predictable future. In response to the protracted displacement situation in Maban, ACTED has been actively implementing projects in the area since 2012. Currently, ACTED is the Camp Coordination and Camp Management (CCCM) agency and Water, Sanitation, and Hygiene (WASH) partner in the four refugee camps. Furthermore, ACTED implements the General Food Distribution (GFD) in two camps, a school feeding program in seven local schools and Food Security and Livelihood (FSL) programming in the host communities. With regards to the WASH situation in the camps, the refugee communities are solely dependent on humanitarian assistance to access water for daily use. In partnership with the United Nations High Commissioner for Refugees (UNHCR), ACTED ensures that the most pressing WASH needs are addressed. More specifically, under Objective 3 ( Supply of potable water increased or maintained ), ACTED aims to operate and maintain the water systems, counting pipelines, tanks, generators and taps; monitor water quality and provide daily treatment; and provides capacity building and regular support to the existing WASH committees, as well as incentives for the work conducted. Under Objective 4 ( Population lives in satisfactory conditions of sanitation and hygiene ) it is envisaged that the intervention would lead to the construction of 1000 household latrines and handwashing facilities; promotion of good hygiene and COVID-19 prevention practices at a rate of 700 door-to-door visits a week; and additional training of the WASH committees in terms of latrine maintenance. KAYA 31,167 In light of the above, in August 2021, ACTED s Appraisal, Monitoring and Evaluation Unit (AMEU) conducted a WASH assessment in all four camps. It builds on similar WASH assessments conducted throughout 2020 and it focuses on measuring UNHCR s outcome indicators (see Table 2) as well as identifying success and challenges of the activities in order to draw lessons learnt and recommendations for the next year. R.Tombak MAP 1. CAMPS IN MABAN MABAN 25,683 GENDRASSA DORO 64,714 YUSIF BATIL 21,562 50,613 Bunj Settlements 66,718 19,490 Host community Refugee camps 50,368 R.Yabus Other features River Roads Refugee camp population (Figures) 1
WASH ASSESSMENT REPORT Providing multi-sectoral assistance to refugee camps in Maban county, South Sudan August 2021 OBJECTIVES OF THE WASH ASSESSMENT 1. Measure non-contractual indicators; 1 2. Investigate the water access and quality in the camps; 2 3. Assess the defecation practices in the camps; 3 4. Investigate the feeling of safety when accessing water points and latrines; 4 5. Assess the knowledge, attitude and practice (KAP) of camp residents on hygiene; 5 6. Assess the awareness and implementation of COVID-19 preventative measurements; 6 7. Understand the overall satisfaction levels with ACTED programming. 7 METHODOLOGY HOUSEHOLD SURVEY WITH CAMP RESIDENTS Simple random sampling strategy: In each camp, the sample was drawn from the total population to represent 95% confidence interval and 7% margin of error to ensure responses from different areas are representative. TABLE 1. SAMPLE BREAKDOWN TOTAL SAMPLE CAMP MOE POPULATION 66,718 203 6.9% Random walk methodology was employed to reduce location of enumerators. DORO preference bias by 50,368 209 6.8% BATIL 808 households interviewed (see Table 1) 25,683 197 7% KAYA Team of 26 enumerators collected the data between 17thof August and 2ndof September 19,490 199 6.9% GENDRASSA took one day, was Enumerator conducted by ACTED Area AME Assistant training 162,259 808 3.44% TOTAL 33 7.2 75% 25% AVERAGE AGE AVERAGE HOUSEHOLD SIZE MEN RESPONDENTS WOMEN RESPONDENTS LIMITATIONS DATA QUALITY: Based on the low level of education and literacy in the area there enumerators and respondents not fully understanding more complex questions, particularly when asked to estimate quantities number of water Nonetheless, extensive was conducted to reduce this limitation. DECLARATORY BASIS: The practice component of the KAP was only assessed on a declaratory basis. A social desirability respondents over-reporting good hygiene practices should be taken into consideration. Furthermore, there is a risk of camp residents exaggerating their needs due to the expectation of receiving more assistance. SENSITIVENESS DEFECATION QUESTIONS: The issue of defecation notoriously sensitive one, and it is likely that beneficiaries conceal the true extent of the phenomenon, or refuse to speak about the issue more often. OF OPEN is a risk of practices is a bias of may (e.g. containers). training 2
WASH ASSESSMENT REPORT Providing multi-sectoral assistance to refugee camps in Maban county, South Sudan August 2021 PERFORMANCE INDICATORS MEASUREMENT 1 1 TABLE 2. ASSESSED INDICATORS AND ACHIEVEMENTS ACHIEVED ACHIEVED ACHIEVED ACHIEVED TARGET INDICATOR DEC 2019 AUG 2020 DEC 2020 AUG 2021 Average available/supplied per person per day1 # of liters of potable water 20 L/P/D N/A 16.8 L/P/D 17.1 L/P/D 14 L/P/D Average # of liters of potable water collected at household level per person per day 20 L/P/D N/A2 N/A 17.1 L/P/D 11.6 L/P/D % of households having at least 2 water containers (10 to 20 liters) in their household 60% 57% 67% 84% 81% % of households with at least 10 liters/person potable water storage capacity 70% N/A 75% 94% 32% % of households collecting drinking water from protected/treated sources 95% 100% 100% 100% 100% % of refugees/PoC reporting queuing for less than 30 minutes at water points 75% 86% 85% 71% 88% % of refugees/PoC reporting feeling safe when collecting water 90% 90% 91% 88% 95% % of refugees reporting using nearest latrines 80% 84% 89% 80% 82% % of households with household or shared- family latrine/toilet 85% 85% 88% 95% 70% % of households reporting defecating in a toilet/latrine 85% 86% 89% 96% 81% % of households with access to soap 70% N/A 34% 50% 77% % of households with good handwashing practices 50% 43% 19% 22% 36% % of respondents knowing at least 3 critical moments when to wash hands. 50% N/A N/A 73% 67% % of household with access to solid waste disposal facility 90% N/A N/A 61% 62% 1The formulationof the indicatorchangedin2021to ..liters of potablewater supplied .The pastdatais thus alsogeared to water supply. 2N/A is used if a previoussurvey didnotincludethe measurementof the indicator
WASH ASSESSMENT REPORT Providing multi-sectoral assistance to refugee camps in Maban county, South Sudan August 2021 WATER ACCESS AND QUALITY 2 2 Between August 2020 and August 2021, the daily average of water produced (not deducting spillage) within the four camps per person was mostly above the SPHERE standard (15L) except for the assessed month of August 2021. This was primarily caused by three factors an unexpected borehole failures, an increased cloud coverage leading to reduced capacity of the solar systems, and reduced amount of available fuel to power the generators. GRAPH 1: MONTHLY WATER PRODUCTION IN LITERS PER PERSON PER DAY 21 20 19 18 17 16 15 14 In order to assess the overall amount of water reaching individual residents, the respondents were asked about the different sizes of water containers, their quantity and frequency with which they were refilled on daily basis. Consistently with respondents reported being able to collect 11.6 l/d/p (Batil 12.7, Doro 9.5, Gendrassa 15.2 and Kaya 8.9). 13 12 Aug (20) Sep Oct Nov Dec Jan Feb Mar Apr May Jun Jul Aug (21) the above data, the l/p/d produced SPHERE standards UNHCR The difference between water produced and water collected can partially be explained by the fact that this data was collected during the rainy season, during which general water availability outside of the taps is greater, and which would not be accounted for in the data collection method which focuses on protected sources. It is indicative in this context that while during the dry season (Dec 2020) this figure was of 17.1, 68% said they did not manage to collect enough water to cover for their basic needs, compared to 57% in August 2021 when this was 11.6. This issue will be further explored in following assessment. Another part of the explanation can be a low storage capacity of the respondents, because even though 81% have at least two 10L-20L containers, the overall average storage capacity per household member is 9.1L, and only 32% have a storage capacity of more than 10L per person. Moreover, when asked why they do not manage to collect enough water to cover basic needs, most of the concerned respondents (89%) noted the lack of sufficient storage capacity, followed by those who said to not have enough containers to transport water (69%), and only then come those saying there is not enough water at the water source (31%, i.e. 18% of all). In respondents continue to use protected ones (taps or hand pumps) as in previous years. For most, the water source functions more than 5 hours a day (68%), with no significant deviations across camps. In line with the above findings of water quantity, majority (71%) of residents confirmed occasionally facing water shortages, ranging from 53% in Gendrassa to 88% in Doro. Most shortages reportedly occur in the morning hours, and 90% of those who experience water shortages face them at least once a week. Water points are largely available, everyone can access them (77% in Doro). terms of water sources, all (100%) GRAPH 2: COLLECTING ENOUGH WATER TO COVER BASIC NEEDS 31% 36% 45% 59% Yes 69% 64% No 55% 41% Batil Doro Gendrassa Kaya MAIN SOURCE OF WATER 84% 16% whereby 88% say TAP STAND HAND PUMP 3Throughout the report, charts do not necessarily equal 100% as percentages are rounded to the nearest whole number. 4
WASH ASSESSMENT REPORT Providing multi-sectoral assistance to refugee camps in Maban county, South Sudan August 2021 GRAPH 3: TRAVEL TO AND WAITING TIME AT THE NEAREST WATER SOURCE 45% 44% 34% 20% travel time 16% 11% 9% 7% 6% 4% 3% 1% waiting time Less than 5 mins 5-10 min 11-20 min 21-30 min 31-1 hour More than 1 hour The waiting times at the water point moderately decreased during the rainy season in comparison to the dry season (71% waiting under 30 mins in December 2020, 88% in August 2021), while the travel time has remained largely similar (96% under 30 minutes both in December 2020 and August 2021), which is consistent with the fact that no additional water points were constructed. GRAPH 4: PERCEIVED WATER QUALITY In terms of the water quality, as shown in Graph 4, consistently with previous assessments, most (94%) considered the water good or very good. Nonetheless, it should be noted that in umda Almak Mufatish of Batil camp had a higher incidence of respondents reporting the water to be bad or very bad . Still, across camps in similar incidence, 58% treat their water before drinking, mainly through filtering (17%) or sedimentation (16%). 50% Very good 45% 37% Good 49% 8% Neutral 1% The camp population s awareness of the existence of the WASH Committees decreased somewhat relative to December 2020 from 81% to 73%, and in most camps it is the WASH committee that repairs the water source (56% in Batil, Gendrassa and Doro), except in Kaya where only 27% state as much. Regarding repair time, 84% stated that the source is usually repaired in less than 6 days (56% in 1-2 days, 28% 3-6 days) 4% 4% Bad 1% 1% Very bad Dec-20 Aug-21 DEFECATION PRACTICES 3 3 GRAPH 5: PRESENCE OF HOUSEHOLD OR FAMILY LATRINE GRAPH 6: USUAL PLACE OF DEFECATION 3% 2% 18% 23% 30% 3% 9% 9% PRACTICE OPEN OPEN DEFECATION DEFECATION 43% 63% 25% 9% 82% 77% 68% 54% Batil Doro Gendrassa Kaya Household latrine Family shared Institutional Open defecate Yes No I prefer not to answer The use of latrines has fluctuated over the past two years from 86% in December 2019 to 96% one year later, to 91% in August 2021 (see Graph 6), with Doro (mainly communities of Jindi and Belatuma) showing the greatest levels of open defecation, i.e. 29% compared to 3% in Gendrassa, 1% in Kaya and 0% in Batil. Reportedly, and somewhat contrarily to the findings from previous years, men tend to defecate openly slightly more than women (11% and 7% respectively), though this difference remains within the margin of error. 5
WASH ASSESSMENT REPORT Providing multi-sectoral assistance to refugee camps in Maban county, South Sudan August 2021 As opposed to the findings in December 2020, most of those who do not use latrine do not do so because their latrine is broken (81%) and not because they do not like using a latrine (90% in December 2020, 25% in August 2021), while more report that the latrine is not clean (35%) and that their latrine has overflown (61%). In this regard, almost half of all respondents, in fact, said their latrine has already overflown (49%), and that mainly during the rainy season, with no significant differences across the camps. Altogether, 81% of the respondents practicing open defecation said that they would construct their own latrine if provided with training but no material or tools (compared to 80% in December 2020). SECURITY 4 4 As shown in Graph 7, the residents feel similarly safe when collecting water and defecating, and these levels are largely in line with the findings from December 2020, with a slight improvement, whereby 8% feel (very) unsafe while defecating compared to 13% in December 2020, and 5% while collecting water compared to 12%. Zooming in on individual camps, however, shows some disparities across the localities, with the residents of Kaya feeling unsafe more often when collecting water (12%, Umda Mak and Kurba) as well as when defecating (10%) the latter phenomenon also observed in Doro (16%, Wadaga and Jindi). The most respondents not to feel safe while either collecting water or defecating is the lack of lighting in the camps. GRAPH 7: HOW SAFE DO RESPODNENTS FEEL WHILE DEFECATING AND COLLECTING WATER 52% 47% 45% 43% 8% 5% 0% 0% prominent reason for Very safe Safe Unsafe Very Unsafe collecting water defecating According to the respondents, water points are the most prone to attract security incidents (45%), followed by latrine use and while openly defecating. An incident was then less likely to occur during the travel to a latrine or water point (11%). As demonstrated below in Graph 8, however, significant disparities were observed across camps, whereby water points tend to be relatively more insecure in Doro and Kaya, while the residents of Batil experience issues on the way to WASH facilities. GRAPH 8: WHEN DO MOST SECURITY INCIDENTS OCCUR 4% 5% 10% 4% 24% 18% 29% 27% 16% 31% 38% 15% 62% 59% 30% 28% Batil Doro Gendrassa Kaya At the water point At the latrine When openly defecating On the way to the water point or latrine 6
WASH ASSESSMENT REPORT Providing multi-sectoral assistance to refugee camps in Maban county, South Sudan August 2021 HYGIENE 5 5 GRAPH 9: HANDWASHING EVENTS PRACTICE AND KNOWLEDGE GRAPH 10: HANDWASHING METHOD - PRACTICE AND KNOWLEDGE 94% 82% 76% 71% 66% Dec-20 Aug-21 knolwedge 56% 55% 54% 36% practice 25% knolwedge practice Before eating Before preparing food Before feeding a child After using latrine After cleaning childs bottom 0% 20% 40% 60% 80% 100% water and soap water and ashes knowledge practice water and chlorine water only The awareness of the daily events to wash hands remained largely the same between December 2020 and August 2021, with differences ranging between 1% and 6%, and 63% know at least 3 critical times to wash hands. A similar pattern can be observed with regards to the actual practice of handwashing in critical moments, with the exception of after using latrine , which reportedly rose by 14% between the two reporting periods. The method the respondents use to wash hands, as shown in Graph 10, also remained similar, with more beneficiaries knowing they should use soap but do not do so, and often use ash as a substitute. An observable and significant difference is that 13% think it is correct to use water only and 12% do so, which represented an increase compared to December 2020. This is driven primarily by respondents from Doro (namely Belatuma, Chali and Jindi), where almost one in three (29%) wash their hands with water only. When all were asked directly about their access to soap, 77% confirmed having as much, and most of the rest (23%) who do not, say that soap is too expensive. At home, majority of respondents use Ibrik (74%), 9% use water bucket and 9% have no handwashing facility, but 80% confirm having a handwashing facility installed by their latrine. 85% SAID THAT THEIR HANDWASHING PRACTICES CHANGED IN THE PAST FEW MONTHS GRAPH 11: CHANGE IN HANDWASHING PRACTICE IN THE PAST MONTHS MORE 46% MAIN REASONS: More awareness More training COVID-19 prevention MAIN REASONS: Less access to soap/chlorine Think handwashing is unimportant 23% 9% 6% Frequency of handwashing Use of soap or chlorine More Less LESS Female respondents of the survey were also asked about their experience in terms of access to female sanitary products. Of these, 93% claim that sanitary products are at least mostly available and accessible, and most also say that women have private space to wash their sanitary products. Those who say that access to sanitary products is limited mainly claim they lack financial resources to procure them. 7
WASH ASSESSMENT REPORT Providing multi-sectoral assistance to refugee camps in Maban county, South Sudan August 2021 The hygiene KAP section of the survey shows that the residents habits in terms of food preservation so as to avoid food poisoning remain largely similar, though covering food and cooking it thoroughly are methods that were used less in August 2021 than in any other assessed period. GRAPH 12: REPORTED METHODS TO AVOID FOOD POISONING 84% 78% 77% 74% 70% 70% 66% 55% 51% 47% 39% 30% Wash vegetables with clean water Keep food on the table Cover food Cook thoroughly Likewise, improper management of grey water are somewhat similar across the bi-annual assessments, though decrease of respondents who think that grey water can contaminate water supply (-20%) and those who think that grey water can lead to higher incidence of disease (-11%). the reported issues with Aug-21 Dec-20 Aug-20 with a marked GRAPH 13: REPORTED ISSUES WITH GREY WATER 78% 71% 70% 68% 57% 51% 50% 30% 25% 23% 22% 21% 18% In the context of these two elements of hygiene promotion, it is interesting also to note that 39% of those with children under 5 years of age (37% of total) said the infants had diarrhoea in the past two weeks, with affected (50%). 14% 11% Increased number of insects Increased risk of diseases Contamination of water supply Makes households dirty Makes the camp look unattractive Doro being most Aug-21 Dec-20 Aug-20 SOLID WASTE MANAGEMENT GRAPH 14: HOUSEHOLDS REPORTING MAINLY DISPOSING SOLID WASTE IN RUBBISH PITS GRAPH 15: TYPE OF PIT USED 53% 42% 42% Household rubbish pit 48% 52% Public rubbish pit Aug-21 Dec-20 Aug-20 As shown in Graph 14, the proportion of households disposing of their waste in dedicated rubbish pits remained identical to the previous assessment in December 2020. However, significant disparities can be observed across the camps, with Doro particularly Belatuma and Jindi - and Kaya showing more challenges than Batil and Gendrassa (15%, 29%, 68%, 57% respectively). Of all, 62% say they have access to a waste pit in a public location, though utmost majority of those with access say that the public pit is far (94%), while some say it is full (38%). Absolute majority (95%) of the respondents would be willing to use plastic bags to collect their waste. 8
WASH ASSESSMENT REPORT Providing multi-sectoral assistance to refugee camps in Maban county, South Sudan August 2021 COVID-19 6 6 Awareness of COVID-19 decreased slightly (93% in August 2021, 98% in December 2020), while the adequacy of information somewhat (from 86% in December 2020, 90% in August 2021), consistently across camps. GRAPH 16: AWARENESS OF COVID-19 reportedly improved 93% 90% Of those aware of COVID-19, 91% know that social distancing is an effective measure to prevent the spread, followed by those mentioning handshake as problematic (50%) and those saying that large gatherings should be avoided (39%). 10% 7% Yes No Heard of COVID-19 Feels informed enough about COVID-19 GRAPH 17: WHETHER COVID IS A RISK FOR HOUSEHOLD Most respondents feel that COVID-19 could pose a risk to their household (76%) as shown in Graph 17, though the residents of Kaya are less preoccupied by the risks of the virus (61%). Of those worried about COVID-19, majority say that the risk is to health (76%), followed by those who think COVID-19 is threatening their livelihood (53%). The residents of Doro are significantly more worried for livelihood (73%), while those in Gendrassa consider mainly health (88%). 6% 18% Yes No I don't know 76% 74% 89% 13% 90% CAN STATE AT LEAST TWO OF THE MOST COVID-19 SYMPTOMS CAN STATE AT LEAST ONE OF THE MOST WAYS TO TRANSMIT COVID- 19 KNOW THAT ASYMPTOMATIC PEOPLE CAN COVID-19 KNOW TO THE HEALTH FACILITY ON SITE IF THEY HAVE CONTRACTED COVID-19 TO IMMEDIATELY GO COMMON COMMON TRANSMIT SUSPECT TO COMPLAINT AND RESPONSE MECHANISM & OVERALL SATISFACTION 7 7 GRAPH 18: KNOWN CRM CHANNELS 69% 53% 33% 25% 12% 10% 7% 4% Talk to ACTED staff Go to ACTED CRM desk Go to the HDC Protection Desk Talk to community leaders Project Management Committee Talk to family Talk to Neighbors Talk to other beneficiaries 9
WASH ASSESSMENT REPORT Providing multi-sectoral assistance to refugee camps in Maban county, South Sudan August 2021 GRAPH 19: WHETHER RESPONDENT WAS INFORMED OF CRM As demonstrated in Graph 18, most beneficiaries would either go to ACTED staff or the help desk if they had any feedback or complaint to share about the assistance. Of all, 71% confirmed having been formally informed about the complaint and response mechanism (58% Batil, 65% Doro, 72% Gendrassa, 89% Kaya) and 76% are aware of the CRM help desk. Up to 85% of beneficiaries are also aware of the complaints they can submit to ACTED, and most would also feel comfortable voicing a complaint (87%). Finally 90% are satisfied with the CRM system as of August 2021, and, as shown below, 97% are satisfied with ACTED s intervention overall. 11% 28% 35% 42% No 89% Yes 72% 65% 58% Batil Doro Gendrassa Kaya 94% 97% 96% ARE OVERALL (VERY) SATISFIED WITH THE ACTED INTERVENTION. (AGREE THAT ACTED S WASH ACTIVITIES ARE THEIR PRIORITY NEEDS. AGREE THAT ACTED STAFF ARE PRESENT IN THE AND OPEN TO DISCUSSION. WASH IN LINE WITH COMMUNITY CONCLUSION AND RECOMMENDATION The WASH activities have been assessed over the past period with three in-depth December 2019. This provided a steady flow of information to track performance, set priorities and understand the changes in the camps throughout the year. in Kaya seems less active and may require more capacity building as well as more sense of ownership over the assets, depending on the experience of the project team. assessments since Hygiene practice in Doro: though most admitted to have access to soap, relatively many residents in Doro think that washing hands with water only is sufficient for good hygiene. In addition, Doro is exhibiting by far the largest incidence of open recommended that the hygiene promotion strategy in Doro be reviewed together with local community leaders in order to design an effective communication strategy. Water storage capacity: as opposed to the findings from the previous years, storage capacity of the households has been observed to be particularly low, which reportedly leads to the incapacity of households to collect enough potable water to cover their basic needs. This finding should be further confirmed through qualitative assessments but distribution of jerry cans should be considered to the extent possible as a necessary facet of the future WASH intervention in all four camps. defecation. It is CRM: while the overall awareness of the CRM should be raised, whereby it should be striven to reach at least 90% of beneficiaries informed about CRM, particular attention should be paid to CRM structures and awareness in Batil, as it was found that this site has significantly lower levels mechanism. WASH committee capacity building: the above findings indicate that while WASH committees in the other camps mostly take charge of minor maintenance of the facilities surrounding the water sources, the one of awareness of the 10