Enhancing South Sudan's Economy: Utilizing Oil Revenues for Diversification and Stability


South Sudan National Economic Conference
U
s
i
n
g
O
i
l
R
e
v
e
n
u
e
s
t
o
D
i
v
e
r
s
i
f
y
a
n
d
S
t
a
b
i
l
i
z
e
t
h
e
E
c
o
n
o
m
y


1
C
o
u
n
t
r
y
C
o
n
t
e
x
t
3
L
e
a
r
n
i
n
g
f
r
o
m
c
a
s
e
s
t
u
d
i
e
s


P
r
e
s
e
n
t
a
t
i
o
n
o
u
t
l
i
n
e

2
C
u
r
r
e
n
t
f
r
a
m
e
w
o
r
k
f
o
r
O
i
l
r
e
s
o
u
r
c
e
s
4
G
e
t
t
i
n
g
t
h
e
r
e
f
r
o
m
h
e
r
e


1
C
o
u
n
t
r
y
C
o
n
t
e
x
t
P
r
e
s
e
n
t
a
t
i
o
n
o
u
t
l
i
n
e
4
H
o
w
e
v
e
r
,
c
l
i
m
a
t
e
c
h
a
n
g
e
a
n
d
‘
n
e
x
t
z
e
r
o
’
p
r
e
s
e
n
t
c
h
a
l
l
e
n
g
e
s
a
n
d
o
p
p
o
r
t
u
n
i
t
i
e
s
S
S
r
a
n
k
e
d
a
m
o
n
g
l
e
a
s
t
r
e
s
i
l
i
e
n
t
,
m
o
s
t
v
u
l
n
e
r
a
b
l
e
,
w
i
t
h
l
e
a
s
t
r
e
a
d
i
n
e
s
s
N
e
t
z
e
r
o
:
e
m
i
s
s
i
o
n
s
r
e
d
u
c
t
i
o
n
t
a
r
g
e
t
c
o
u
l
d
r
e
d
u
c
e
G
D
P
i
n
o
i
l
d
e
p
e
n
d
e
n
t
c
o
u
n
t
r
i
e
s
b
y
7
0
%
G
i
v
e
n
c
l
i
m
a
t
e
f
i
n
a
n
c
e
i
n
f
l
o
w
s
~
U
S
$
0
.
1
7
b
n
p
.
a
,
S
S
f
a
c
e
s
a
g
a
p
o
f
U
S
$
9
.
2
b
n
p
.
a
S
S
n
e
e
d
s
~
U
S
D
1
0
.
1
7
b
n
p
.
a
o
v
e
r
2
0
2
0
-
3
0
t
o
r
e
s
p
o
n
d
t
o
c
l
i
m
a
t
e
c
h
a
n
g
e
S
o
u
t
h
S
u
d
a
n
i
s
e
n
d
o
w
e
d
w
i
t
h
s
i
g
n
i
f
i
c
a
n
t
n
a
t
u
r
a
l
r
e
s
o
u
r
c
e
s
b
o
t
h
r
e
n
e
w
a
b
l
e
s
a
n
d
n
o
n
-
r
e
n
e
w
a
b
l
e
s
N
a
t
u
r
a
l
c
a
p
i
t
a
l
p
e
r
c
a
p
i
t
a
(
c
o
n
s
t
a
n
t
2
0
1
8
U
S
D
)
5
S
t
r
u
c
t
u
r
a
l
t
r
a
n
s
f
o
r
m
a
t
i
o
n
i
s
a
m
a
j
o
r
p
o
l
i
c
y
a
m
b
i
t
i
o
n
,
b
u
t
l
i
t
t
l
e
p
r
o
g
r
e
s
s
m
a
d
e
…
C
o
n
t
r
i
b
u
t
i
o
n
s
t
o
r
e
a
l
G
D
P
g
r
o
w
t
h
2
0
1
2
-
2
0
2
2
Structural transformation and
diversification
were key
ambitions of government’s
economic policy at
independence.
Progress has been limited due
to:
Oil legacy;
Political frictions;
Inadequate enablers including
institutions, relevant skills,
infrastructure…
Structural transformation is
achievable and requires:
human and physical capital
accumulation, institutional and
infrastructure capabilities
P
r
e
s
e
n
t
a
t
i
o
n
o
u
t
l
i
n
e
2
C
u
r
r
e
n
t
f
r
a
m
e
w
o
r
k
f
o
r
O
i
l
r
e
s
o
u
r
c
e
s
7
I
n
s
t
i
t
u
t
i
o
n
a
l
f
r
a
m
e
w
o
r
k
b
e
i
n
g
d
e
v
e
l
o
p
e
d
…
P
r
o
g
r
e
s
s
M
a
d
e
1
.
P
u
b
l
i
c
a
t
i
o
n
o
f
o
i
l
a
n
n
u
a
l
r
e
p
o
r
t
s
2
.
C
r
e
a
t
i
o
n
o
f
t
h
e
P
F
M
o
v
e
r
s
i
g
h
t
a
n
d
t
e
c
h
n
i
c
a
l
c
o
m
m
i
t
t
e
e
s
3
.
E
s
t
a
b
l
i
s
h
m
e
n
t
o
f
t
h
e
N
a
t
i
o
n
a
l
R
e
v
e
n
u
e
A
u
t
h
o
r
i
t
y
(
N
R
A
)
4
.
M
e
r
g
e
r
o
f
C
u
s
t
o
m
s
i
n
t
o
w
i
t
h
N
R
A
5
.
E
s
t
a
b
l
i
s
h
m
e
n
t
o
f
t
h
e
C
a
s
h
M
a
n
a
g
e
m
e
n
t
C
o
m
m
i
t
t
e
e
6
.
E
f
f
o
r
t
s
t
o
o
p
e
r
a
t
i
o
n
a
l
i
z
e
t
h
e
T
r
e
a
s
u
r
y
S
i
n
g
l
e
A
c
c
o
u
n
t
I
n
s
t
i
t
u
t
i
o
n
a
l
F
r
a
m
e
w
o
r
k
1.
Petroleum sector regulated and managed by the Ministry of
Petroleum through the Petroleum Exploration and Production
Authority
2. Petroleum Act 2012, the main policy framework guiding the
sector – also requires full disclosure of information and quarterly
reports
3. Other legislations and agreements:
i.
Companies Act of 2012;
ii.
Investment Act of 2012;
iii.
Investment Promotion Regulation of 2012;
iv.
Taxation Act of 2009; and
v.
Model agreements – to inform Production Sharing
Agreements (PPAs) or Exploration and Production Sharing
Agreements (EPSAs)
3
L
e
a
r
n
i
n
g
f
r
o
m
c
a
s
e
s
t
u
d
i
e
s
P
r
e
s
e
n
t
a
t
i
o
n
o
u
t
l
i
n
e
9
R
e
f
l
e
c
t
i
n
g
o
n
M
a
u
r
i
t
i
u
s
a
n
d
B
o
t
s
w
a
n
a
’
s
e
x
p
e
r
i
e
n
c
e
s
…
B
o
t
s
w
a
n
a
L
a
n
d
l
o
c
k
e
d
,
p
o
p
u
l
a
t
i
o
n
~
2
m
i
l
l
i
o
n
.
A
t
i
n
d
e
p
e
n
d
e
n
c
e
i
n
1
9
6
6
,
a
g
r
i
c
u
l
t
u
r
e
(
l
i
v
e
s
t
o
c
k
)
,
l
e
d
e
c
o
n
o
m
i
c
g
r
o
w
t
h
~
>
4
0
%
o
f
G
D
P
.
D
i
a
m
o
n
d
w
a
s
d
i
s
c
o
v
e
r
e
d
a
f
e
w
y
e
a
r
s
l
a
t
e
r
B
e
t
w
e
e
n
1
9
7
4
a
n
d
1
9
9
4
,
v
a
l
u
e
o
f
d
i
a
m
o
n
d
e
x
p
o
r
t
s
i
n
c
r
e
a
s
e
d
,
a
v
.
3
0
%
p
.
a
m
i
n
i
n
g
s
e
c
t
o
r
a
c
c
o
u
n
t
e
d
f
o
r
>
4
0
%
o
f
G
D
P
,
w
h
i
l
e
a
g
r
i
c
u
l
t
u
r
e
a
t
o
n
l
y
2
.
2
%
o
f
G
D
P
d
u
r
i
n
g
2
0
0
0
s
.
G
D
P
g
r
o
w
t
h
a
v
.
6
.
8
%
o
v
e
r
1
9
9
0
-
2
0
0
9
L
e
s
s
o
n
s
:
p
o
l
i
t
i
c
a
l
s
t
a
b
i
l
i
t
y
;
u
s
e
o
f
d
i
a
m
o
n
d
r
e
v
e
n
u
e
s
t
o
f
i
n
a
n
c
e
o
t
h
e
r
s
e
c
t
o
r
s
;
e
n
a
b
l
e
r
s
f
o
r
p
r
i
v
a
t
e
s
e
c
t
o
r
d
e
v
e
l
o
p
m
e
n
t
(
i
n
t
e
r
n
a
t
i
o
n
a
l
c
o
n
t
r
a
c
t
l
a
w
,
t
r
a
d
e
a
n
d
m
o
n
e
t
a
r
y
i
n
t
e
g
r
a
t
i
o
n
w
i
t
h
S
o
u
t
h
A
f
r
i
c
a
e
c
o
n
o
m
y
,
t
a
x
c
o
n
c
e
s
s
i
o
n
s
o
n
p
r
o
f
i
t
s
a
n
d
c
a
p
i
t
a
l
t
r
a
n
s
f
e
r
s
)
.
M
a
u
r
i
t
i
u
s
Small island with population ~ 1.3 million (2021)
with no mineral resources.
At independence in 1968, economy was driven by
sugar cane farming ~20% of GDP; >60% of exports
earnings
trade shocks
Embarked on structural transformation in 1980:
industrialization, introduction of a free trade zone
(FTZ) – spurred the competitive service and
tourism sectors.
By 2009, sugar accounted for <3% of GDP, while
textiles exceeded 5% and tourism 10% of GDP.
RDGP growth av. 5% over 1980-2009
L
e
s
s
o
n
:
F
T
Z
c
a
t
a
l
y
z
e
d
c
r
e
a
t
i
o
n
o
f
g
l
o
b
a
l
b
u
s
i
n
e
s
s
s
e
c
t
o
r
e
x
p
o
r
t
o
f
f
i
n
a
n
c
i
a
l
s
e
r
v
i
c
e
s
a
n
d
B
P
O
.
P
r
e
s
e
n
t
a
t
i
o
n
o
u
t
l
i
n
e
4
G
e
t
t
i
n
g
t
h
e
r
e
f
r
o
m
h
e
r
e
P
e
a
c
e
a
n
d
s
t
a
b
i
l
i
t
y
:
a
c
c
e
l
e
r
a
t
e
i
m
p
l
e
m
e
n
t
a
t
i
o
n
o
f
P
e
a
c
e
A
g
r
e
e
m
e
n
t
I
n
c
r
e
a
s
e
c
o
m
p
e
t
i
t
i
v
e
n
e
s
s
e
.
g
.
,
i
n
f
r
a
s
t
r
u
c
t
u
r
e
,
h
u
m
a
n
c
a
p
i
t
a
l
—
r
e
l
e
v
a
n
t
a
n
d
d
e
m
a
n
d
d
r
i
v
e
n
s
k
i
l
l
s
…
S
t
r
e
n
g
t
h
e
n
t
r
a
n
s
p
a
r
e
n
c
y
:
o
i
l
r
e
v
e
n
u
e
a
c
c
o
u
n
t
(
P
e
t
r
o
l
e
u
m
A
c
t
2
0
1
2
)
,
d
i
s
c
l
o
s
u
r
e
o
f
G
o
v
t
r
e
v
e
n
u
e
s
a
n
d
d
e
b
t
,
E
I
T
I
,
c
o
r
r
u
p
t
i
o
n
P
r
i
v
a
t
e
i
n
v
e
s
t
m
e
n
t
a
n
d
f
i
n
a
n
c
e
:
d
i
s
c
l
o
s
e
t
r
a
n
s
a
c
t
i
o
n
s
,
i
d
e
n
t
i
f
y
o
p
p
o
r
t
u
n
i
t
i
e
s
,
s
h
a
r
e
s
u
c
c
e
s
s
f
u
l
m
o
d
e
l
s
…
A
d
v
a
n
c
i
n
g
r
e
g
i
o
n
a
l
i
n
t
e
g
r
a
t
i
o
n
–
f
i
n
a
l
i
z
e
p
e
n
d
i
n
g
E
A
C
p
r
o
t
o
c
o
l
s
(
C
u
s
t
o
m
s
M
a
n
a
g
e
m
e
n
t
,
m
o
v
e
m
e
n
t
o
f
l
a
b
o
r
a
n
d
c
a
p
i
t
a
l
…
0
D
e
s
i
g
n
a
n
e
c
o
n
o
m
i
c
d
i
v
e
r
s
i
f
i
c
a
t
i
o
n
s
t
r
a
t
e
g
y
–
o
i
l
f
o
r
i
n
c
l
u
s
i
v
e
d
e
v
e
l
o
p
m
e
n
t
;
e
n
a
b
l
e
r
s
i
n
c
l
u
d
i
n
g
m
a
c
r
o
s
t
a
b
i
l
i
t
y
1
2
3
4
5
6
A
c
t
i
o
n
s
b
y
d
i
v
e
r
s
e
s
t
a
k
e
h
o
l
d
e
r
s
:
S
S
G
o
v
e
r
n
m
e
n
t
,
M
D
B
s
/
D
F
I
s
,
g
l
o
b
a
l
c
o
m
m
u
n
i
t
y
P
o
l
i
c
y
R
e
c
o
m
m
e
n
d
a
t
i
o
n
s
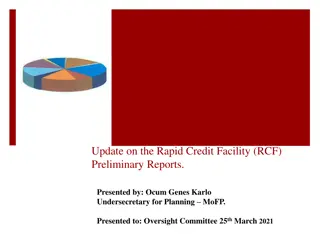
South Sudan's National Economic Conference focuses on leveraging oil revenues to diversify the economy amidst challenges like climate change. The country aims for structural transformation but faces barriers like the legacy of oil dependence and political frictions. Progress is hindered by inadequate infrastructure and skills. The presentation outlines the country's current framework, emphasizing the need for institutional development in the oil sector.

Download Presentation

Please find below an Image/Link to download the presentation.
The content on the website is provided AS IS for your information and personal use only. It may not be sold, licensed, or shared on other websites without obtaining consent from the author. Download presentation by click this link. If you encounter any issues during the download, it is possible that the publisher has removed the file from their server.
E N D
Presentation Transcript
South Sudan National Economic Conference Using Oil Revenues to Diversify and Stabilize the Economy
Presentation outline 1 3 Learning from case studies Country Context 2 4 Getting there from here Current framework for Oil resources
Presentation outline 1 Country Context
South Sudan is endowed with significant natural resources both renewables and non-renewables Natural capital per capita (constant 2018 USD) However, climate change and next zero present challenges and opportunities 25,000 Timber Ecosystem services 20,000 SS ranked among least resilient, most vulnerable, with least readiness Cropland Pastureland USD per capita Oil 15,000 Net zero: emissions reduction target could reduce GDP in oil dependent countries by 70% Metals and minerals 10,000 SS needs ~ USD 10.17 bn p.a over 2020-30 to respond to climate change 5,000 Given climate finance inflows ~ US$ 0.17 bn p.a, SS faces a gap of US$ 9.2 bn p.a 0 2011 2012 2013 2014 2015 2016 2017 2018 4
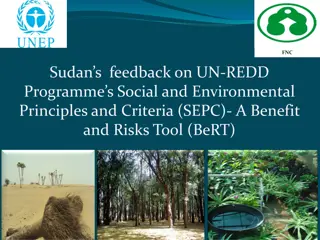
Structural transformation is a major policy ambition, but little progress made Structural transformation and diversification were key ambitions of government s economic policy at independence. Contributions to real GDP growth 2012-2022 100% 40.0 80% 30.0 Progress has been limited due to: Oil legacy; Political frictions; Inadequate enablers including institutions, relevant skills, infrastructure 60% 20.0 40% 10.0 20% 0.0 0% -10.0 2012 2013 2014 2015 2016 2017 2018 2019 2020 2021 2022(e) -20% -20.0 -40% -30.0 Structural transformation is achievable and requires: human and physical capital accumulation, institutional and infrastructure capabilities -60% -40.0 -80% -50.0 -100% -60.0 Agriculture, forestry and fishing Mining and quarrying and electricity, oil, gas & water Manufacturing Construction Source: AfDB Statistics Services Real GDP Growth (RHS scale) 5
Presentation outline 2 Current framework for Oil resources
Institutional framework being developed Institutional Framework Progress Made 1.Petroleum sector regulated and managed by the Ministry of Petroleum through the Petroleum Exploration and Production Authority 1. Publication of oil annual reports 2. Creation of the PFM oversight and technical committees 2. Petroleum Act 2012, the main policy framework guiding the sector also requires full disclosure of information and quarterly reports 3. Establishment of the National Revenue Authority (NRA) 3. Other legislations and agreements: i. Companies Act of 2012; ii. Investment Act of 2012; iii. Investment Promotion Regulation of 2012; iv. Taxation Act of 2009; and v. Model agreements to inform Production Sharing Agreements (PPAs) or Exploration and Production Sharing Agreements (EPSAs) 4 . Merger of Customs into with NRA 5. Establishment of the Cash Management Committee 6. Efforts to operationalize the Treasury Single Account 7
Presentation outline 3 Learning from case studies
Reflecting on Mauritius and Botswanas experiences Botswana Mauritius Small island with population ~ 1.3 million (2021) with no mineral resources. Landlocked, population ~2 million. At independence in 1966, agriculture (livestock), led economic growth ~>40% of GDP. Diamond was discovered a few years later At independence in 1968, economy was driven by sugar cane farming ~20% of GDP; >60% of exports earnings trade shocks Between 1974 and 1994, value of diamond exports increased, av. 30% p.a mining sector accounted for >40% of GDP, while agriculture at only 2.2% of GDP during 2000s. Embarked on structural transformation in 1980: industrialization, introduction of a free trade zone (FTZ) spurred the competitive service and tourism sectors. GDP growth av. 6.8% over 1990-2009 By 2009, sugar accounted for <3% of GDP, while textiles exceeded 5% and tourism 10% of GDP. Lessons: political stability; use of diamond revenues to finance other sectors; enablers for private sector development (international contract law, trade and monetary integration with South Africa economy, tax concessions on profits and capital transfers). RDGP growth av. 5% over 1980-2009 Lesson: FTZ catalyzed creation of global business sector export of financial services and BPO. 9
Presentation outline 4 Getting there from here
Policy Recommendations Peace and stability: accelerate implementation of Peace Agreement Strengthen transparency: oil revenue account (Petroleum Act 2012), disclosure of Govt revenues and debt, EITI, corruption Design an economic diversification strategy oil for inclusive development; enablers including macro stability 1 2 3 Actions by diverse stakeholders: SS Government, MDBs/DFIs, global community Increase competitiveness e.g., infrastructure, human capital relevant and demand driven skills 4 Private investment and finance: disclose transactions, identify opportunities, share successful models 5 Advancing regional integration finalize pending EAC protocols (Customs Management, movement of labor and capital 0 6