User Attributes and Engagement Reports Analysis
The analysis covers various aspects such as the percentage of Chinese-speaking users, the top interest among active users, the highest average engagement time, the impact of user engagement time on conversion likelihood, and the top acquisition channels. It also compares Organic Social and Organic Shopping performance, providing insights for refining marketing strategies.
Download Presentation
Please find below an Image/Link to download the presentation.
The content on the website is provided AS IS for your information and personal use only. It may not be sold, licensed, or shared on other websites without obtaining consent from the author. Download presentation by click this link. If you encounter any issues during the download, it is possible that the publisher has removed the file from their server.

Presentation Transcript
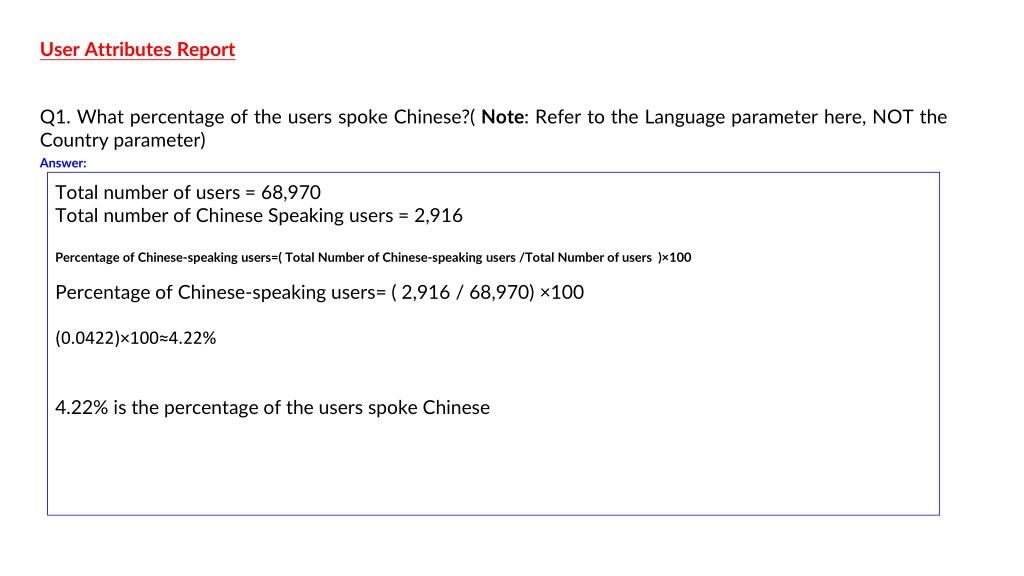
User Attributes Report Q1. What percentage of the users spoke Chinese?( Note: Refer to the Language parameter here, NOT the Country parameter) Answer: Total number of users = 68,970 Total number of Chinese Speaking users = 2,916 Percentage of Chinese-speaking users=( Total Number of Chinese-speaking users /Total Number of users ) 100 Percentage of Chinese-speaking users= ( 2,916 / 68,970) 100 (0.0422) 100 4.22% 4.22% is the percentage of the users spoke Chinese
User Attributes Report Q2. Out of the total active users, what was the top interest among them? How much revenue was acquired from these users? Answer: Out of the total active users, Technology/Technophiles was the top interest among them. $37,683.04 revenue was acquired from these users
Engagement Report Q3. On which day was the average engagement time the highest? How much was it? Answer: On Thursday 9th November was the average engagement time highest. It was 1 minute 52 seconds .
User Attributes Reports Q4. Can we say that users with an average engagement time of 49 seconds are more likely to convert, irrespective of the website s language? Answer: Averaging 49 seconds in engagement time is generally short, suggesting users might not spend extensive time on the website. However, concluding that these users are more likely to convert is not straightforward. Conversion likelihood depends on various factors, including the nature of your content, the simplicity of the conversion process, and user intent. It's crucial to consider industry benchmarks, test different engagement times, and analyze conversion rates for specific segments. Without context and detailed analysis, a short engagement time alone doesn't necessarily indicate a higher likelihood of conversion, and further examination is needed.
Acquisition Report Q5. What are the top 5 acquisition channels in terms of users you can see from the report? Answer: The top 5 acquisition channels in terms of users I can see from the report are 1. Direct 2. Organic search 3. Cross network 4. Unassigned 5. Referral
Acquisition Report Q6. Organic Social performed better than Organic Shopping , true or false? Give suitable reasons to support your answer. Answer: . Organic Social performed better than Organic Shopping , FALSE Reasons The data indicates that 'Organic Shopping' outperformed 'Organic Social,' it suggests that the former exhibited stronger performance in terms of user engagement, conversions, or other pertinent key performance indicators. Continuous monitoring of these metrics can provide valuable insights for refining and optimizing your marketing strategies to further enhance overall performance.
Free Form Report Q7. Go to free-form explorations. In dimensions, select only Page Title and Screen Class . Drag this to the Rows section. Add Entrances in metrics and drag it to the Values section. Set the date range from May 24th, 2023, to June 20th, 2023. On the report, ensure that you click on the arrow next to the title Entrances on the right-hand side column. Ensure it is a downward-facing arrow to see all the accurate data in the Entrances column. What do you understand from the data on this page? Answer: In terms of device categories, the dataset distinguishes between "desktop," "mobile," and "tablet," offering a comprehensive view of user engagement on different platforms. Numeric values associated with each combination of device category, city, and event type provide quantitative insights into user engagement patterns. However, a more detailed analysis would require additional context regarding the goals and nature of the website or application under consideration.
Monetization Report Q8. Set the date range from March 1st, 2023, to May 31st, 2023. Which product brings in the most revenue? Justify your answer. Answer: Total revenue was $354,332.66 on the date range from March 1st, 2023, to May 31st, 2023. Google Cloud Desktop Neon Sign was the product brings in the most revenue. $8,494.00 was the revenue was generated by Google Cloud Desktop Neon Sign.
Funnel Exploration Q9. Set the date range from May 24th, 2023, to June 20th, 2023. From which country did the most number of users visit the website? Justify your answer. Hint: Use Country in the breakdown. Answer: USA was the country did the most number of users visit the website May 24th, 2023, to June 20th, 2023. Total user was 51,864 USA users 20,675
Funnel Exploration Q10. People from which of the following countries purchased on the website - India, US, China and Japan? Justify your answer. Answer: Total purchase was 285 as you can see in picture Based on this analysis, people from the United States and India, made purchases on the website during the specified period. However, it appears that no purchases were recorded from Japan and china during this time frame.
Segment Overlap Q11. Set the date range from May 24th, 2023, to June 20th, 2023. Move the Active User metric to the Values section. In which country did users aged 25 to 54 access the website from a tablet? How many users were this? Make sure you break down by Country . Answer: . In which country did users aged 25 to 54 access the website from a tablet? Ans USA How many users were this? Ans 1668
Segment Overlap Q12. How many transactions did these users make ? Hint: Further breakdown by Country and Transactions in the Value bar. Answer: total transactions was 34.416.12 USD
Cohort Exploration Q13. Set the date range from May 24th, 2023, to June 20th, 2023. For Cohort 1 (May 24th to May 27th, 2023) what percentage of paid traffic returned in week 4? Be sure to include your calculations. Hint: Ensure the segment paid traffic is dragged to the Segment Comparison section. This should be the only segment here. Remove all the breakdowns.. Answer: The percentage of paid traffic returned in week 4 = 11.72% Calculation Percentage Returned=(Returning Users from Paid Traffic / Total Users in Paid Traffic ) 100 = (85/725) x 100 11.72 %
Cohort Exploration Q14. Using the same data for Cohort 2 (May 28th, 2023, to June 3rd, 2023), what percentage of learners returned in Week 3? Include your calculation. Answer: The percentage of learners returned in Week 3 = 35.03 % Calculation - Percentage Returned=(Returning Users from Paid Traffic / Total Users in Paid Traffic ) 100 (279/796) x 100 35.03%
Cohort Exploration Q15. Did Cohort 1 ( May 24-27) perform better than Cohort 2 (May 28 - June 3)? Use Week 3 s data to calculate your answer. Answer: No, comparing the percentages, Cohort 2 (May 28 - June 3) performed better than Cohort 1 (May 24- 27). Cohort 1 (May 24-27): 11.72% Cohort 2 (May 28 - June 3): 35.03% The higher percentage for Cohort 2 indicates a higher proportion of returning users from paid traffic within that cohort.
User Lifetime Exploration Q16. Move the MobileTraffic segment to the SegmentComparisons section. Move the First User Source dimension to rows. Start Date: May 24 , End Date: It would automatically be set to the previous day. In the Values section, ensure that you have ActiveUsers , Lifetime Transactions: Average and Lifetime Engagement Duration: Average . Which was the most popular First User Source through mobile traffic? How many users came through this medium? Support your answer with a screenshot Answer: