Supporting Attendance: Understanding the Issues.
Explore the importance of attendance and engagement in schools, understanding the issues surrounding absenteeism, the impact on attainment, and the role of relationships in promoting good attendance. Discover the difference between attendance and engagement, the various types of engagement, and reasons for absence. Gain valuable insights on how schools can address attendance challenges effectively.
Download Presentation
Please find below an Image/Link to download the presentation.
The content on the website is provided AS IS for your information and personal use only. It may not be sold, licensed, or shared on other websites without obtaining consent from the author. Download presentation by click this link. If you encounter any issues during the download, it is possible that the publisher has removed the file from their server.

Presentation Transcript
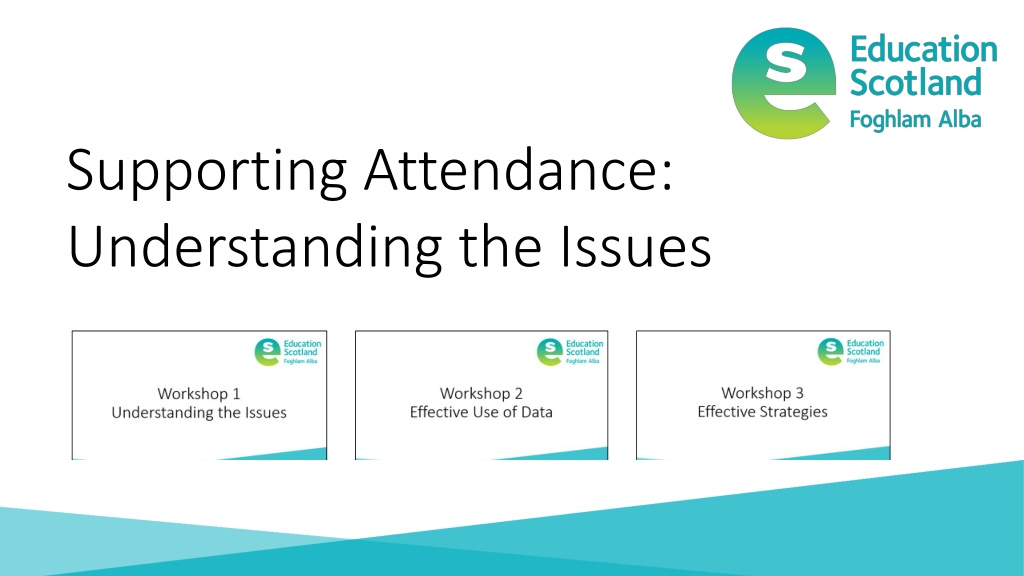
Supporting Attendance: Understanding the Issues
Improving attendance in Scotland Read Improving Attendance in Scotland
Workshop 1 Understanding the Issues
What is the difference between attendance and engagement? TASK
Engagement is as important as attendance Engagement happens when children and young people give attention to, and are actively involved in, a learning task. Types of engagement include: emotional (interest, boredom, happiness) behavioural (attention, effort, persistence) cognitive (motivation, learning strategies) agency (expressing interests and needs)
Understanding the reasons for absence The causes of absence are multifaceted and should be considered only as part of a bigger picture of the individual child or young person. (Forth Valley West Lothian)
Talking Point Relationships are important School attendance issues cannot easily be separated from the relationships, behaviours and wellbeing of the pupils and wider school community and it is important that schools view the promotion of attendance in this context. Included, Engaged & Involved: part 1 A positive culture and ethos are key determinants in promoting good attendance for all Journal of Positive Behaviour Interventions
All absence impacts attainment Research suggests all forms of absence (truancy, sickness absence, exceptional domestic circumstances, and family holidays) negatively impact achievement and attainment (Klein and Sosu, 2023). This is echoed by John et al (2021) noting that poor attendance at school, whether due to absenteeism or exclusion, leads to multiple social, educational, and lifelong socio-economic disadvantages.
Where is the threshold in your school? Where is the threshold in your school? TASK 80% 75% A B 85% 90% D C
Impact of absence Impact Percentage Number of days missed 100% 0 Gives a learner the best chance of success. 95% 9 days Less chance of success due to poor attendance. Learners could drop a whole grade in secondary school. > 90 % 19 days > 85% 27 days Serious implications on learning and progress. > 80% More than 36 days Serious implications on learning and progress.
Academic year Percentage Attendance Trend 2010 to 2011 93.1% 2012 to 2013 93.6% 2014 to 2015 93.7% Attendance rates as a percentage by academic year 2016 to 2017 93.3% 94 2018 to 2019 93% 93.7 2020 to 2021 92% 93.6 93 93.3 93.1 2022 to 2023 90.2% 93 Percentage 92 92 91 90 90.2 89 88 2010/11 2012/13 2014/15 2016/17 2018/19 2020/21 2022/23 Academic year
Attendance 2023 Pupils with no ASN 91.6 Pupils with ASN 87.5 Highest 20% of SIMD (Least deprived) 93.5 Lowest 20% of SIMD (Most deprived) 86.8 All Pupils 90.2 82 84 86 88 90 92 94 96 Lowest 20% of SIMD (Most deprived) 86.8 Highest 20% of SIMD (Least deprived) 93.5 All Pupils Pupils with ASN Pupils with no ASN Total 90.2 87.5 91.6
Primary School Attendance Pupils with no ASN 92.9 Pupils with ASN 90.3 Highest 20% of SIMD (Least deprived) 94.8 Lowest 20% of SIMD (Most deprived) 89.1 All Pupils 92.2 National Attendance % 86 87 88 89 90 91 92 93 94 95 96 Highest 20% of SIMD (Least deprived) 94.8 Lowest 20% of SIMD (Most deprived) All Pupils Pupils with ASN Pupils with no ASN Primary 92.2 89.1 90.3 92.9
Secondary School Attendance National attendance % Pupils with no ASN 89.6 Pupils with ASN 84.9 Highest 20% of SIMD (Least deprived) 91.8 Lowest 20% of SIMD (Most deprived) 83.7 All Pupils 87.7 78 80 82 84 86 88 90 92 94 Lowest 20% of SIMD (Most deprived) 83.7 Highest 20% of SIMD (Least deprived) 91.8 All Pupils Pupils with ASN Pupils with no ASN Secondary 87.7 84.9 89.6
Talking Point Absence in relation to poverty Klein & Sosu (2023) suggest absences may cause greater harm to children and young people living in lower socio-economic circumstances because their families may have fewer resources to compensate for lost instructional time. Children and young people living in higher social economic circumstances appear to recover more quickly from learning loss related to sickness absence. This may be owing to fewer underlying health conditions and families using assets to catch up with missed lesson content (Klein and Sosu, 2023)
Talking Point What does the research say? a) All absence affects attainment, even when related to illness An average of 90% attendance is the equivalent of missing an entire school year by 3rd year of high school b) c) School absences can be associated with lower educational attainment and a greater likelihood of non- employment d) Late coming is an early indication that absence may become a problem e) Absences may cause greater harm to those who experience socio-economic deprivation f) An increase in unauthorised absence from age 10 to 11 can indicate more significant absence in later years
Groups more vulnerable to low attendance children and young people impacted by poverty secondary-aged pupils young people from Gypsy and Traveller communities pupils with additional support needs including: children and young people who have experienced care young carers children and young people who have experienced exclusion children and young people with social and emotional needs linked to mental health
Secondary schools and attendance Talking Point Positive perceptions of attitudes to school decrease with pupil stage, particularly up to S4.
Workshop 2 Effective Use of Data
What might this be telling us? What might this be telling us? Talking Point The attendance of S5 in 2022-2023 has increased by 5%. From 86% in Term 1 to 91% in Term 4. Attendance in P7 has risen by 3%. From 90% in 2021-2022 to 93% in 2022-2023. Overall school attendance in Anytown Primary has increased from 90% to 91%. What wrong with this data as evidence of improvement? Any other examples?
Data and attendance research tell us Data and attendance research tell us (Klein et al., 2022). Using the right data is critical. Interventions which focus on attendance should consider the underlying reasons. Health, behavioural or social factors should be important considerations for designing interventions. Knowledge of specific reasons will aid the design of successful interventions to improve attainment by incorporating support that addresses the underlying reasons for absenteeism
Talking Point What data What data do I need? do I need? All absence can affect progress 90% threshold for action is unreliable Certain groups are more vulnerable to absence Absence in higher as a pupil moves through secondary Absence is only a symptom of what else is happening.
Data for improvement. Data for improvement. What does the research tell us? What does the research tell us? a. Establishing the purpose and use of data b. Defining and classifying data c. Creating effective processes and systems d. Interpreting and analysing data e. Developing a data informed culture TASK f. Using data for improvement
Attendance Data Attendance Data TASK Part 2 Thinking about attendance data in your establishment/local authority, consider the following: 1. What, if any, are the attendance issues within your establishment? 2. What are the main reasons for absence? 3. What is working well? 4. What are the areas for further development or what might need to be done differently? 5. What might be your next steps? 6. What support might you need?
Workshop 3 Effective Strategies
How do we improve attendance? I don t think there s ever a silver bullet to any problem. There are always several answers and solutions to a problem. Susana Martinez
What can we do? TASK
Improving motivation and engagement How do you promote a sense of belonging, empowerment and identity? What impact does this have on attendance? Talking Point
Pushes and Pulls Pushes and Pulls Pull to Push away Push away Pull to
Putting Children, Young People and Families at the Centre Putting Children, Young People and Families at the Centre 3. Understand the causes 1. Identify target pupils 2. Gather all views 4. Co-create intervention plan 5. Implement, monitor and evaluate Attendance Targeted Intervention Guidance (Forth Valley West Lothian)
Resources Included, Engaged and Involved Part 1 This national policy provides the framework for the promotion and management of attendance and absence. Forth Valley and West Lothian RIC Attendance Toolkit An interactive attendance toolkit, created by FVWL Regional Improvement Collaborative. Promoting Attendance: self-reflection questions for educational settings. This resource provides self-reflection questions for schools to further explore and implement practices which will encourage good attendance.
Thank you! Improving Attendance Workshop feedback form